Orphan Drug Royalties: The Economics of Small Populations in Pharmaceutical Royalty Financing

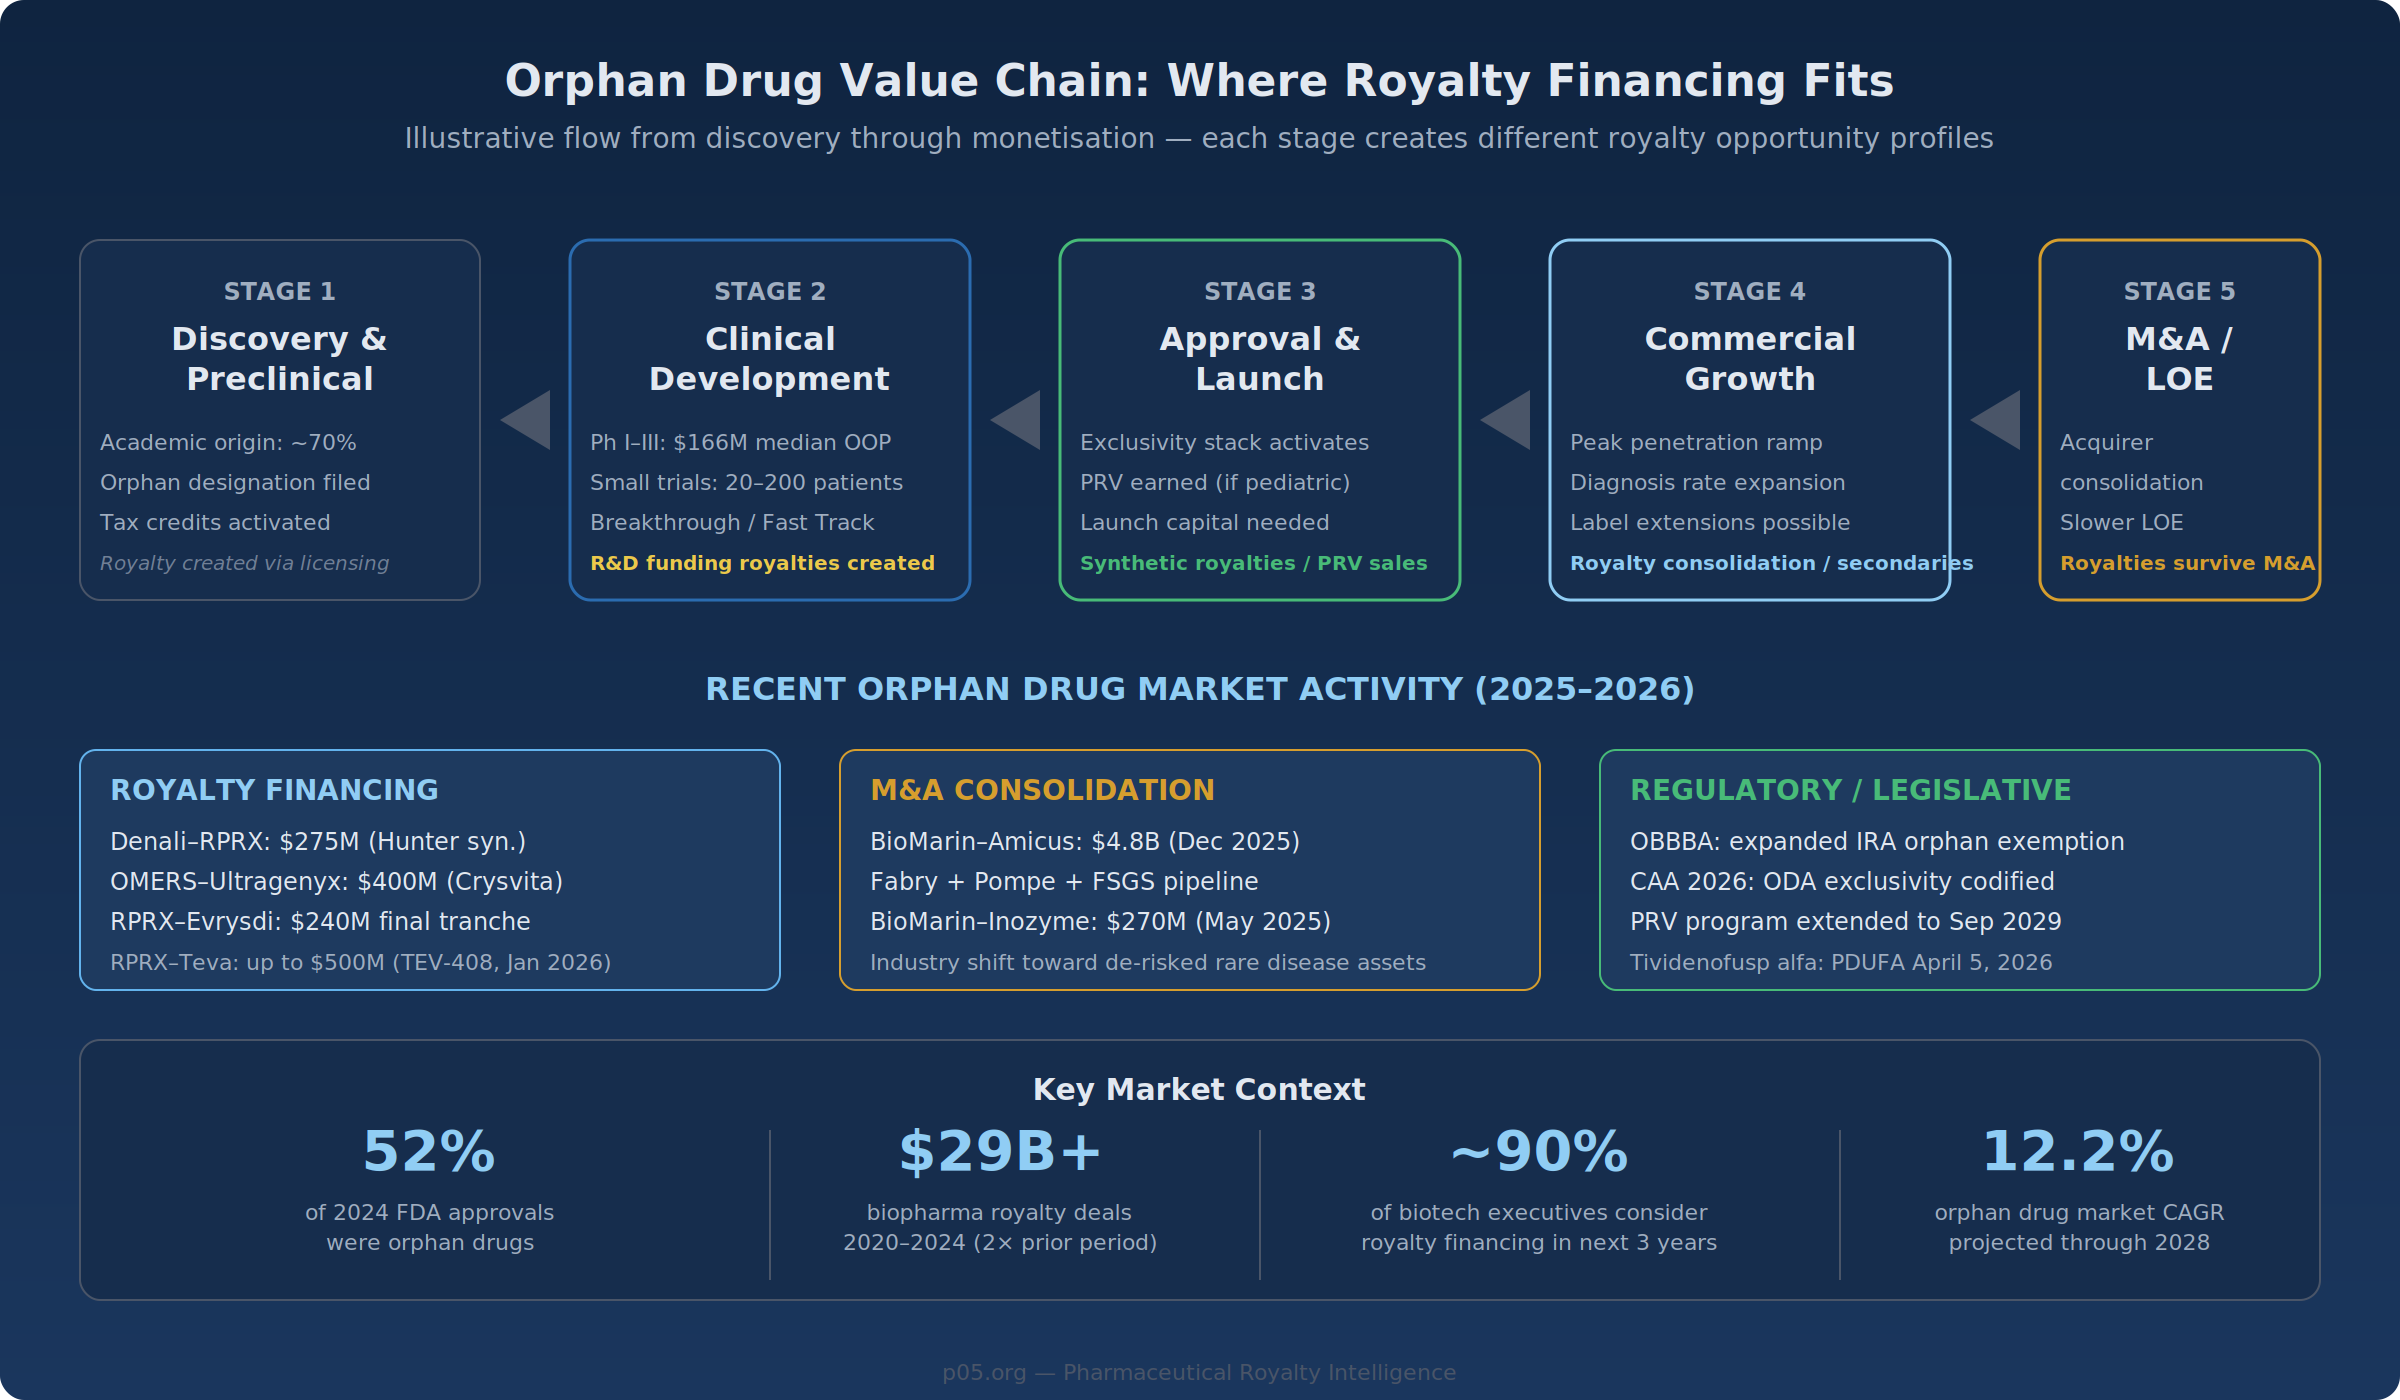
In December 2025, Royalty Pharma agreed to pay $275 million for a 9.25% synthetic royalty on Denali Therapeutics' tividenofusp alfa—a treatment for Hunter syndrome, a lysosomal storage disorder affecting roughly 2,000 patients in the United States. The deal carried a 3.0× cap multiple, with an accelerated 2.5× return if achieved by early 2039.
Weeks later, BioMarin announced a $4.8 billion acquisition of Amicus Therapeutics, adding Fabry and Pompe disease franchises to its rare disease portfolio. On February 3, 2026, the Consolidated Appropriations Act of 2026 codified orphan drug exclusivity scope, extended the Rare Pediatric Disease Priority Review Voucher program through 2029, and resolved a long-running judicial ambiguity about the Orphan Drug Act's reach.
These events—spanning royalty financing, M&A, and legislation—reflect a market that is rapidly repricing orphan drug assets. This piece examines the economic and regulatory dynamics that shape orphan drug royalty transactions, along with the risks and structural considerations that complicate them.
The Pricing Arithmetic
The economic model for orphan drugs inverts the typical pharmaceutical revenue equation. Where mass-market drugs generate returns through volume—millions of patients at moderate price points—orphan drugs compress revenue into a smaller patient base with a correspondingly larger per-patient numerator.
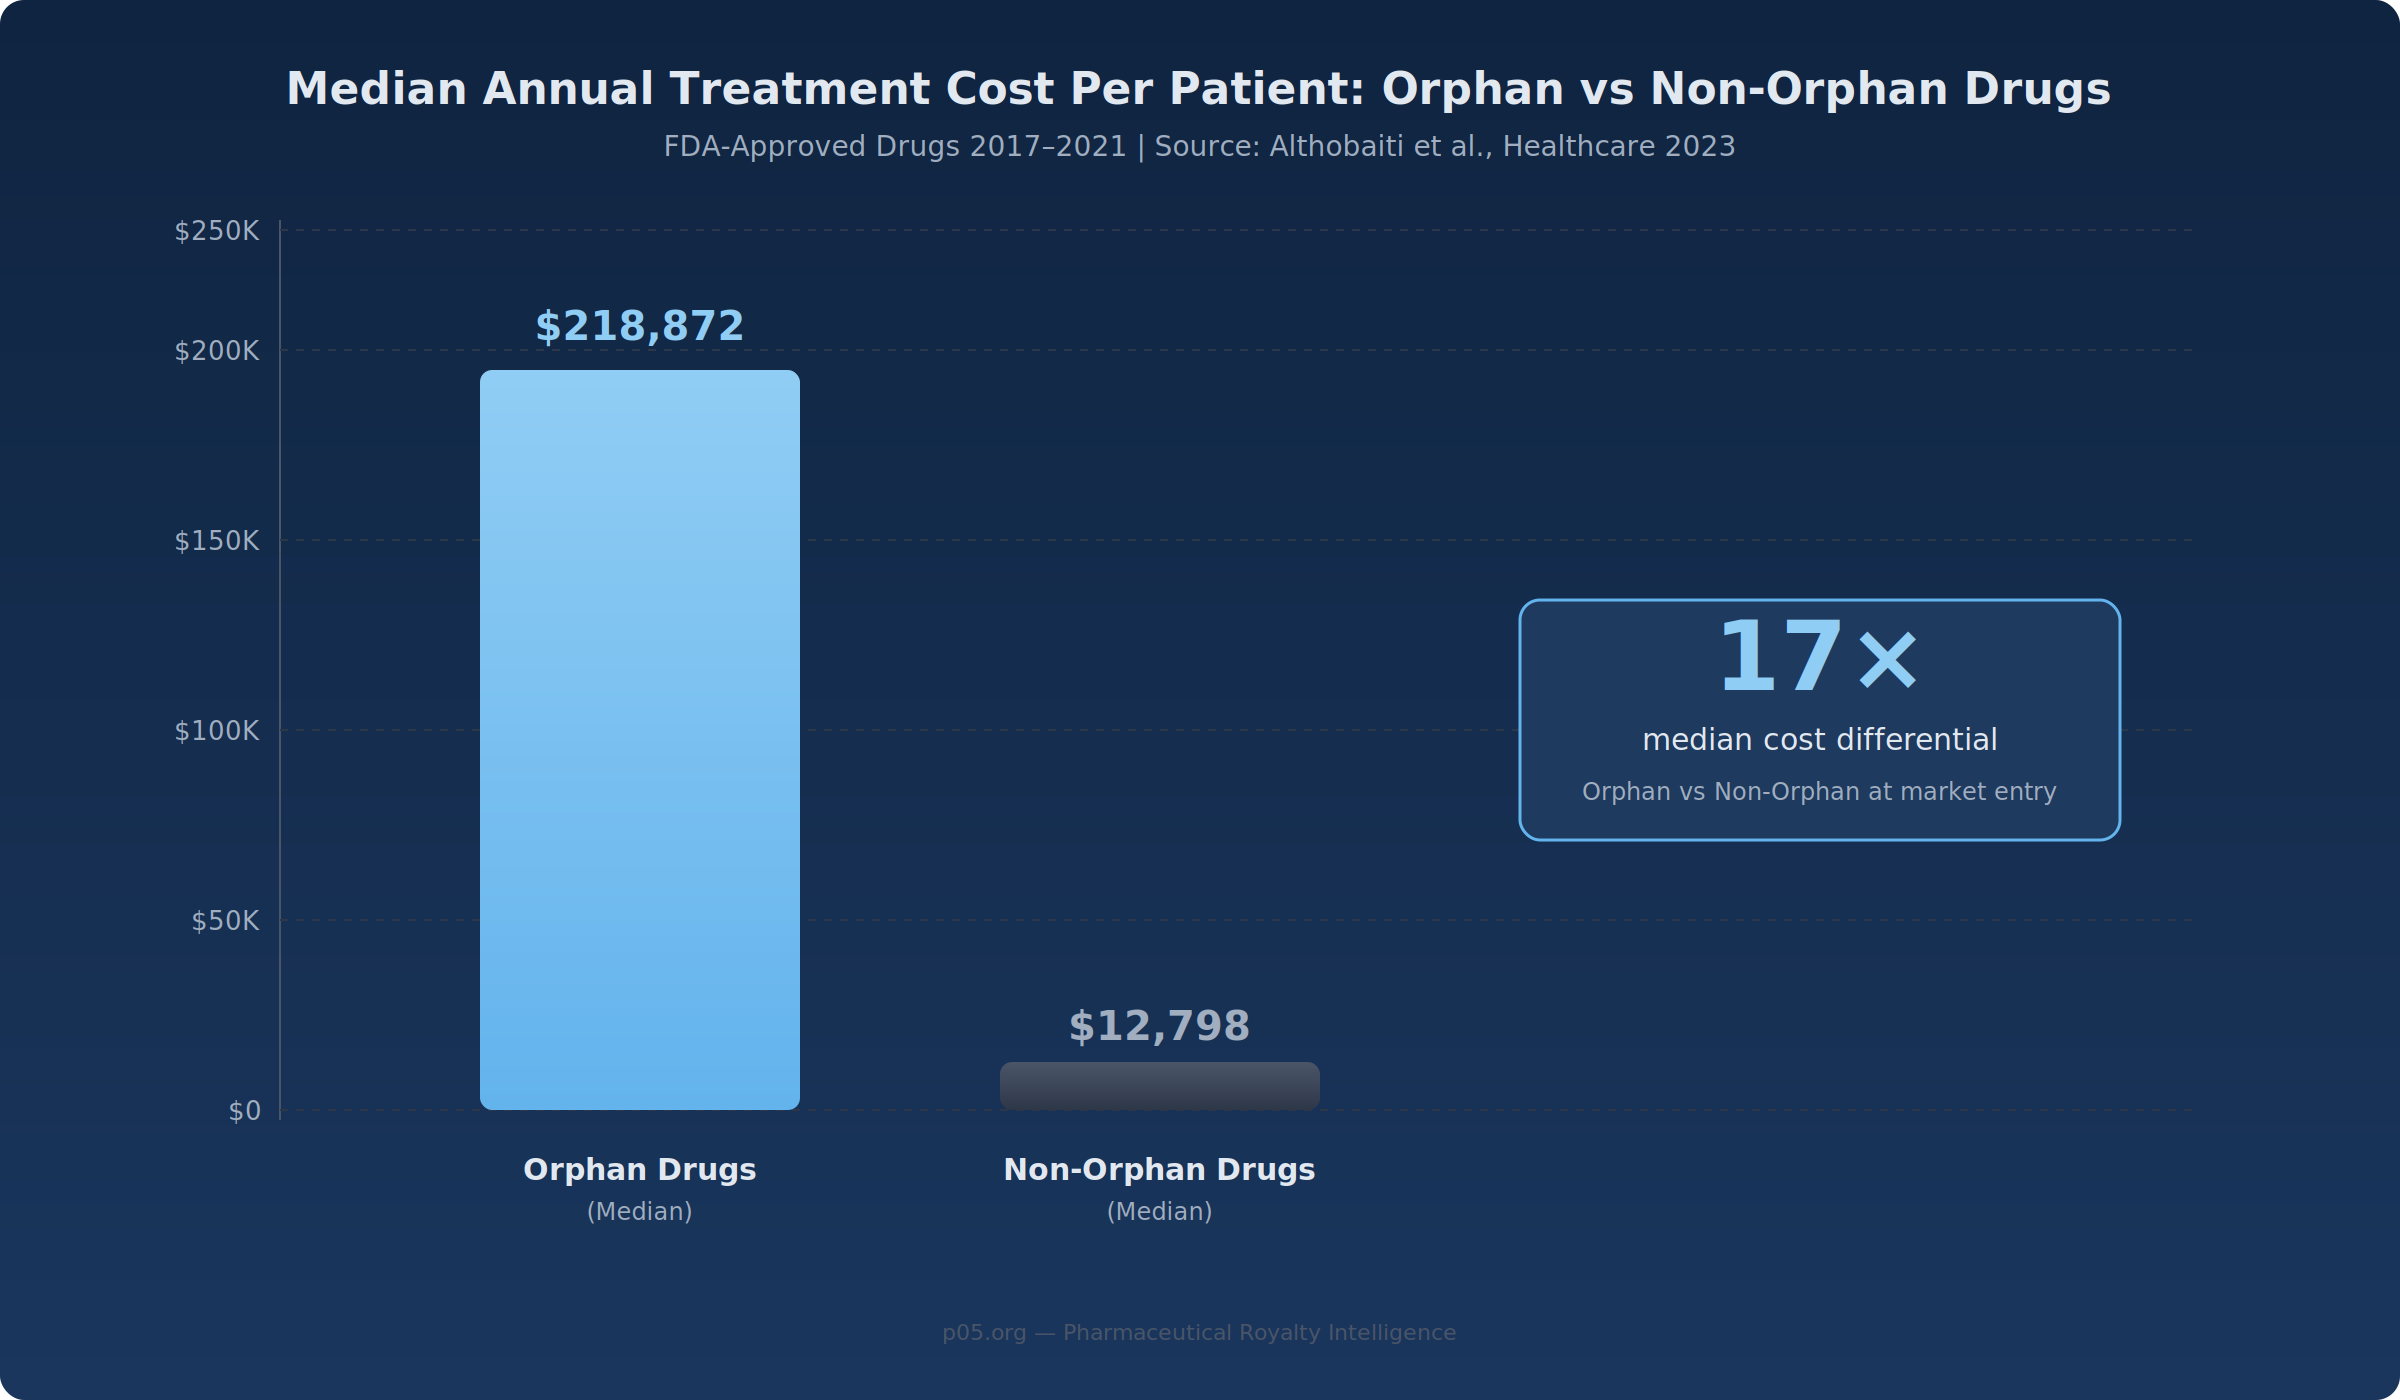
A 2023 Healthcare study analysing FDA approvals from 2017–2021 found the median annual treatment cost for orphan drugs was $218,872 per patient, compared with $12,798 for non-orphan drugs—a 17× differential. Gene therapies and ultra-rare biologics push further: Zolgensma carries a one-time U.S. list price exceeding $2 million, and enzyme replacement therapies for Fabry and Gaucher disease routinely exceed $300,000 annually.
For royalty investors, this arithmetic produces a distinctive cash-flow profile. A 5% royalty on a drug treating 3,000 patients at $250,000 per year generates $37.5 million annually on $750 million in net sales—the same royalty revenue as a 5% royalty on a mass-market drug treating 500,000 patients at $1,500 each. The royalty payment is identical; the risk profile underlying it is not.
What Sustains Per-Patient Pricing
Three structural factors support orphan drug pricing, though none is permanent and each faces its own set of pressures.
The first is the frequent absence of therapeutic alternatives. The FDA's Office of Orphan Products Development has facilitated over 1,100 orphan drug approvals since 1983, yet the majority of the estimated 7,000+ known rare diseases remain without approved treatments. Where treatments exist, they often represent the sole approved option, reducing the payer leverage that drives price competition in crowded therapeutic areas.
The second is budget irrelevance at the plan level. An orphan drug costing $400,000 per year for 1,500 patients generates total national spend of $600 million—substantial in isolation, but distributed across hundreds of payers, it rarely crosses the threshold that triggers aggressive formulary management. This dynamic may weaken as orphan drug launches accelerate and cumulative plan-level spend grows, but for any individual royalty, the budget impact calculus currently holds.
The third is the reputational cost of restricting access. Denying coverage for a treatment that represents a patient's only option for a life-threatening condition carries political and regulatory risks that most payers avoid. Prior authorisation and step therapy—common tools for managing specialty drug costs—are less effective when there is nothing to step through.
Regulatory Moats: The Exclusivity Stack
Patent protection matters for all pharmaceutical royalties. What distinguishes orphan assets is an additional layer of regulatory exclusivity that operates independently of—and frequently outlasts—patent terms.
Orphan Drug Exclusivity
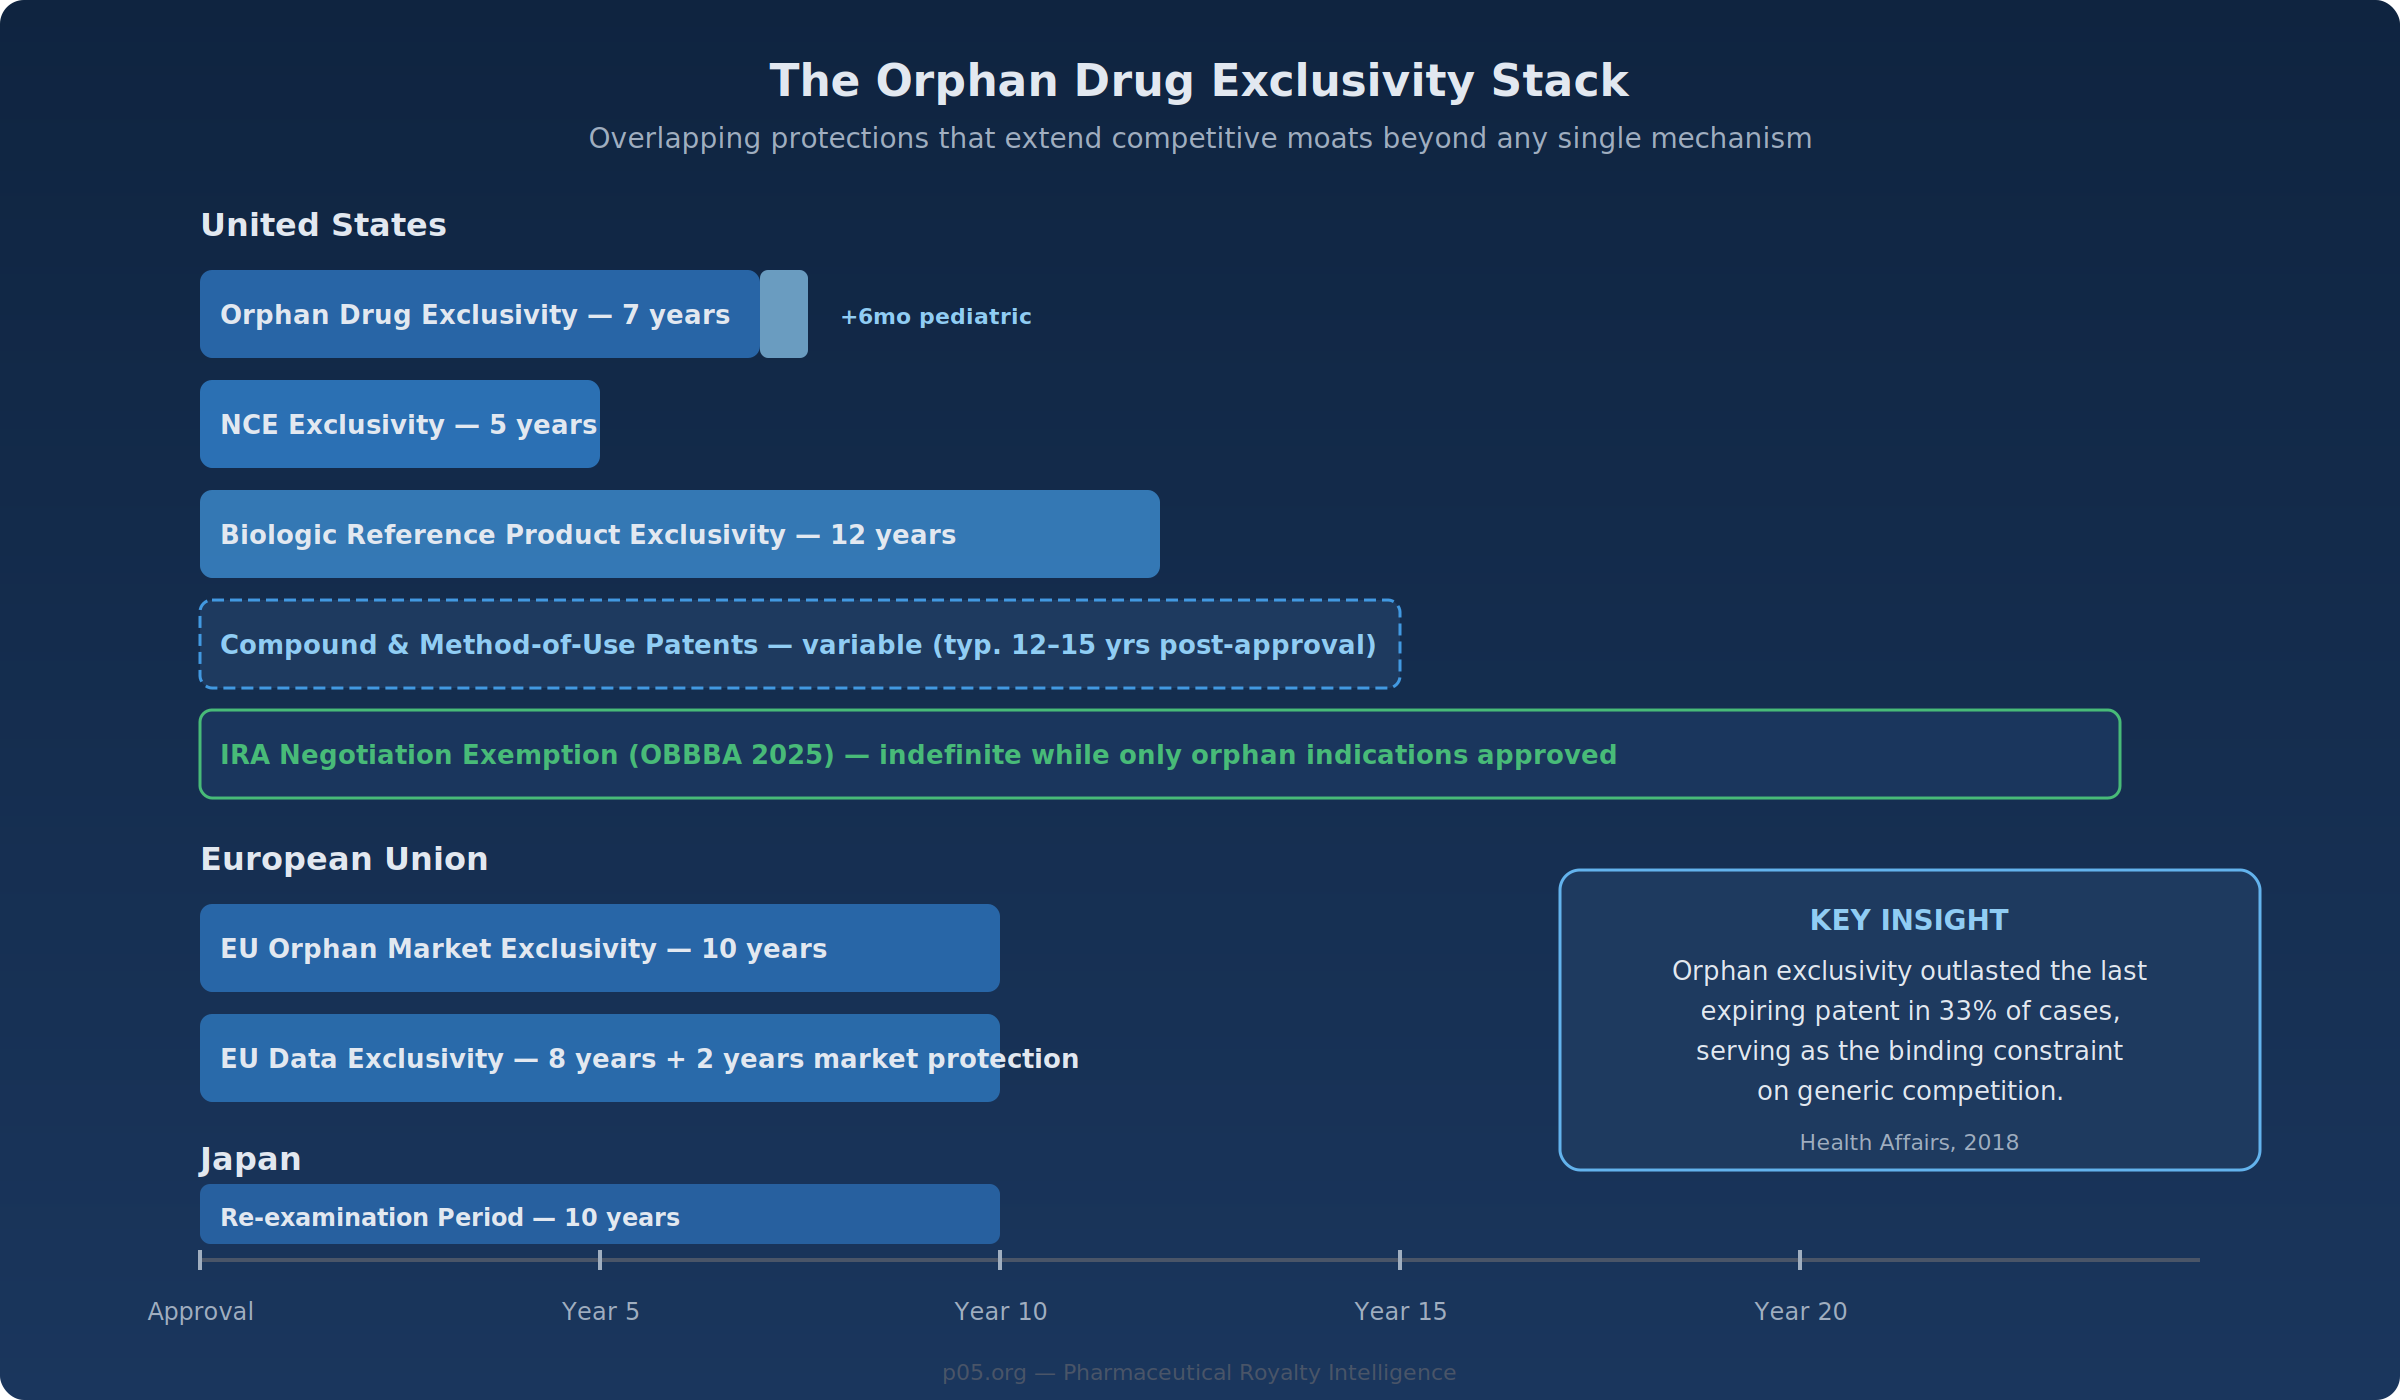
The Orphan Drug Act grants seven years of market exclusivity in the United States from the date of FDA approval, during which the agency will not approve another version of the same drug for the same orphan indication. In the European Union, the corresponding period is ten years under Regulation (EC) No 141/2000. Japan offers ten years of re-examination period exclusivity.
The scope of this exclusivity was a subject of legal uncertainty until recently. The Eleventh Circuit's 2021 Catalyst Pharmaceuticals decision interpreted the Orphan Drug Act to substantially broaden exclusivity scope, but the Consolidated Appropriations Act of 2026 (signed February 3, 2026) codified the FDA's longstanding narrower interpretation, specifying that exclusivity prevents approval of the same drug for the same "approved use or indication" within a rare disease—not the disease as a whole. For royalty investors, the CAA 2026 provides welcome regulatory clarity, even if the narrower scope slightly reduces the theoretical breadth of orphan exclusivity.
A Health Affairs study examining small-molecule orphan drugs approved between 1985 and 2014 found that orphan exclusivity outlasted the final expiring patent in 33% of cases, and in 50% of drugs approved during the 1985–1994 cohort. Orphan exclusivity can therefore serve as the binding constraint on generic competition, independent of patent portfolio strength.
Overlapping Protections
Modern orphan drugs frequently benefit from multiple simultaneous protections: orphan exclusivity (7 years, US), new chemical entity exclusivity (5 years), biologic reference product exclusivity (12 years for biologics), pediatric extensions (+6 months), patent term restoration, and underlying compound and method-of-use patents. For biologics with orphan designation—an increasingly common category—the 12-year reference product exclusivity often subsumes the orphan period. But the orphan layer retains independent value because it blocks novel biologics (not just biosimilars) from pursuing the same indication, unless they demonstrate clinical superiority.
The practical effect is a layered defensive position. Evrysdi (risdiplam) for spinal muscular atrophy—which generated approximately CHF 1.6 billion (~$1.8 billion) in 2024 sales with 18% year-over-year growth—benefits from orphan exclusivity, small-molecule NCE exclusivity, composition patents, and the inherent clinical difficulty of developing competing oral therapies for SMA. The competitive moat is not one wall; it is a series of overlapping protections.
Legislative Developments: IRA, OBBBA, and the CAA 2026
The regulatory landscape for orphan drugs has shifted substantially over the past four years, with each legislative change altering the risk calculus for long-duration royalty streams.
The IRA's Original Framework (2022)
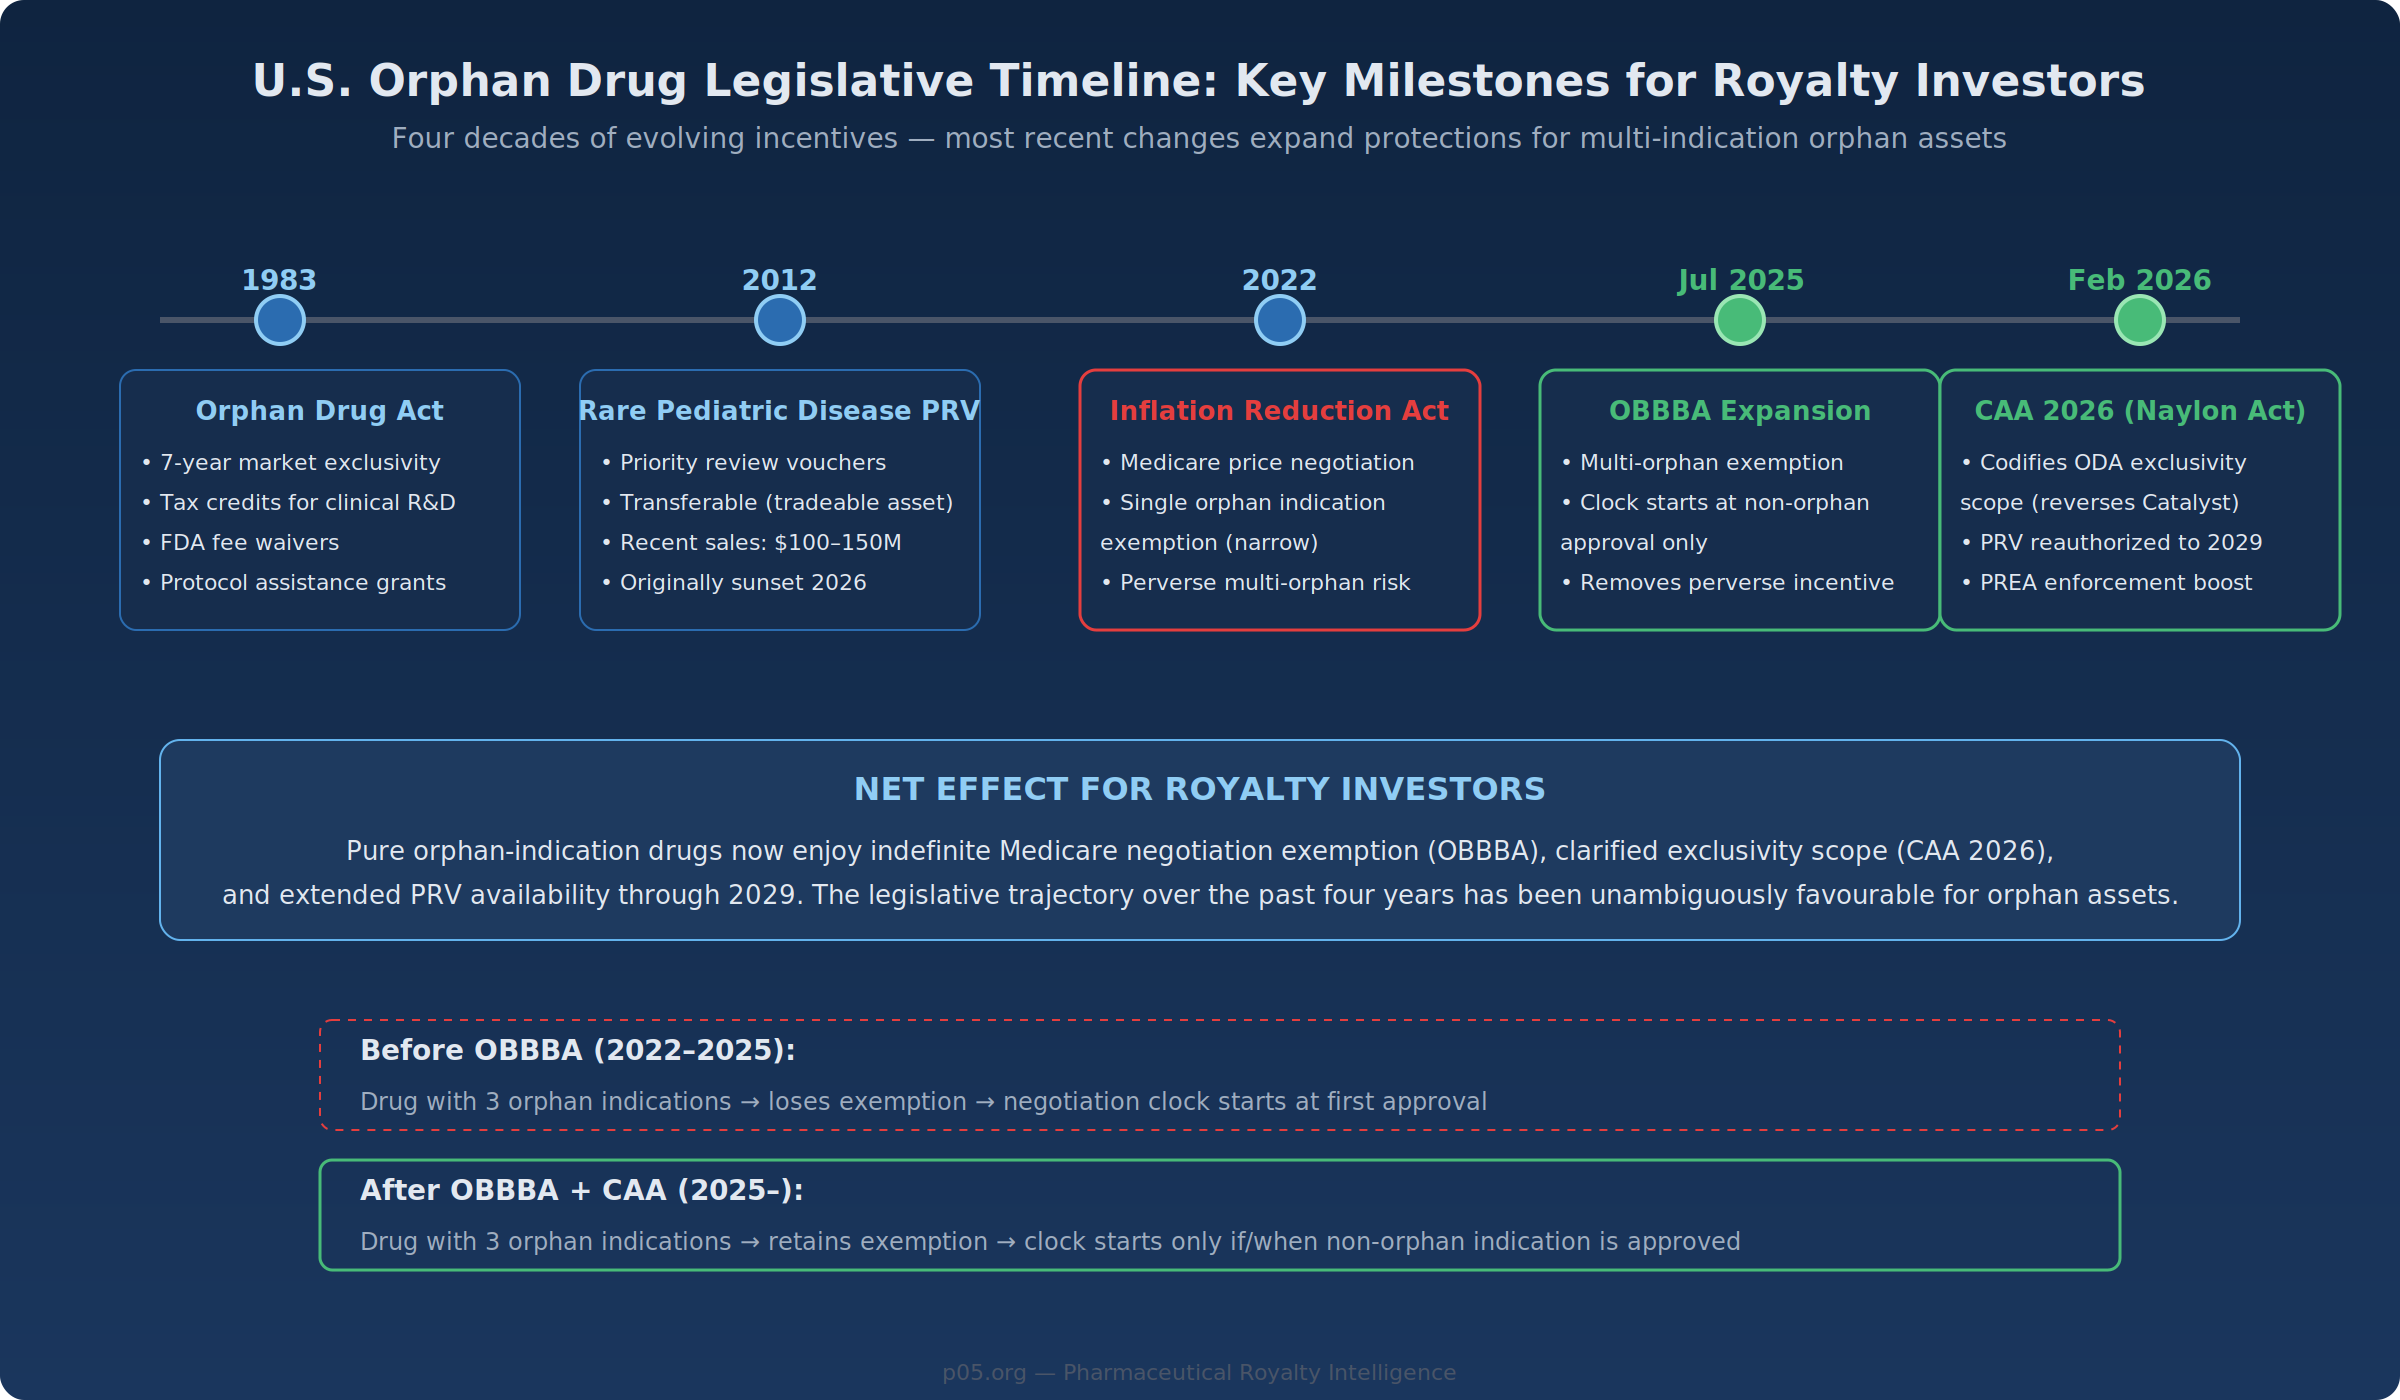
The Inflation Reduction Act of 2022 authorised Medicare to negotiate prices on selected drugs, starting nine years after approval for small molecules and thirteen years for biologics. The original statute exempted drugs with a single orphan indication—but only if that single rare disease was the drug's sole approved indication. Drugs with multiple orphan designations, even without a non-orphan indication, fell outside the exemption.
This created a perverse dynamic: companies developing an orphan drug for multiple rare diseases risked losing their negotiation exemption by pursuing additional indications—precisely the kind of label expansion that generates value for royalty investors.
The OBBBA Expansion (July 2025)
The One Big Beautiful Bill Act, signed into law in July 2025, restructured the orphan drug exclusion in two respects. First, the exclusion now applies to drugs with one or more orphan designations, provided none of the approved indications is for a non-orphan condition. Second, the negotiation countdown clock starts only upon approval for a non-orphan indication rather than the date of first approval.
For drugs that remain exclusively in rare disease indications, negotiation risk under the IRA drops substantially. This shift should be particularly significant for orphan biologics with projected peak sales above $2 billion—assets that would otherwise be likely to attract CMS attention.
The Consolidated Appropriations Act (February 2026)
The CAA 2026, signed on February 3, 2026, addressed several related issues. It codified the scope of orphan drug exclusivity (reversing the Catalyst decision), reauthorised the Rare Pediatric Disease Priority Review Voucher program through September 2029, and strengthened FDA enforcement authority for Pediatric Research Equity Act obligations.
The PRV reauthorisation is particularly relevant. Rare Pediatric Disease PRVs have recently transacted at $100–150 million (Zevra Therapeutics sold a voucher for $150 million following MIPLYFFA's approval for Niemann-Pick type C). For smaller rare disease companies, PRV sales represent a complementary form of non-dilutive monetisation alongside royalty transactions.
A Note of Caution
The legislative trajectory over the past four years has been favourable for orphan assets. However, the political environment is not static. Orphan drug pricing has attracted increased scrutiny—particularly where drugs originally designated for small populations accumulate non-orphan indications and reach multi-billion-dollar sales. The current framework rests on continued political will to exempt orphan-only products from price negotiation. Royalty investors should factor the possibility of future legislative reversals into their long-duration models, even if the near-term trend is positive.
The Denominator: Small Populations as a Structural Feature
The conventional view holds that small patient populations represent a risk factor—fewer patients means less revenue, more volatile demand, and greater sensitivity to individual patient events. From the royalty investor's perspective, this framing captures part of the picture but misses countervailing dynamics that can improve risk-adjusted returns.
Epidemiological Stability
Rare diseases are overwhelmingly genetic in origin. The incidence of Hunter syndrome, cystic fibrosis, or Fabry disease does not fluctuate with lifestyle trends, seasonal patterns, or prescribing fashions. The addressable patient population is determined by allele frequency and population genetics—parameters that change on evolutionary timescales.
Compare this with mass-market therapeutic areas. GLP-1 agonist royalties depend on obesity prevalence trends, competitive launches, formulary positioning decisions, and evolving clinical guidelines. PD-1 inhibitor royalties face tumor-agnostic label expansions by competitors and the perpetual risk that a novel mechanism shifts the treatment paradigm. An orphan drug treating a genetically defined population of 5,000 patients has an addressable market that is substantially more predictable—a characteristic that, all else equal, supports tighter confidence intervals in revenue modelling.
Competitive Entry Economics
The same small population that supports premium pricing also discourages competitive entry. Developing a second drug for a condition affecting 2,000 patients requires the same Phase I–III infrastructure as a mass-market drug, but the revenue opportunity is a fraction of the size. Capitalised clinical development costs for orphan drugs have been estimated at $291 million (2013 USD), versus $412 million for non-orphan drugs—lower, but not proportionally lower relative to the addressable market.
The result is that many orphan drugs face zero or one direct competitor over their commercial lifetime. Elaprase (idursulfase) has been the sole approved enzyme replacement therapy for Hunter syndrome since 2006. If Denali's tividenofusp alfa wins approval (PDUFA April 5, 2026), it would represent the first new entrant in two decades—and with a differentiated mechanism (blood-brain barrier penetration) rather than a me-too product.
This is not universally true. Some orphan drug categories—particularly oncology—see increasing competitive intensity as multiple companies pursue parallel development paths. But for many rare genetic diseases, the market structure remains oligopolistic at best and monopolistic at its most concentrated.
Case Studies: Transactions in Practice
The following transactions illustrate different risk-return profiles across the orphan royalty spectrum.

Denali–Royalty Pharma: Tividenofusp Alfa (Hunter Syndrome)
The December 2025 transaction represents a pre-approval orphan royalty at its most granular.
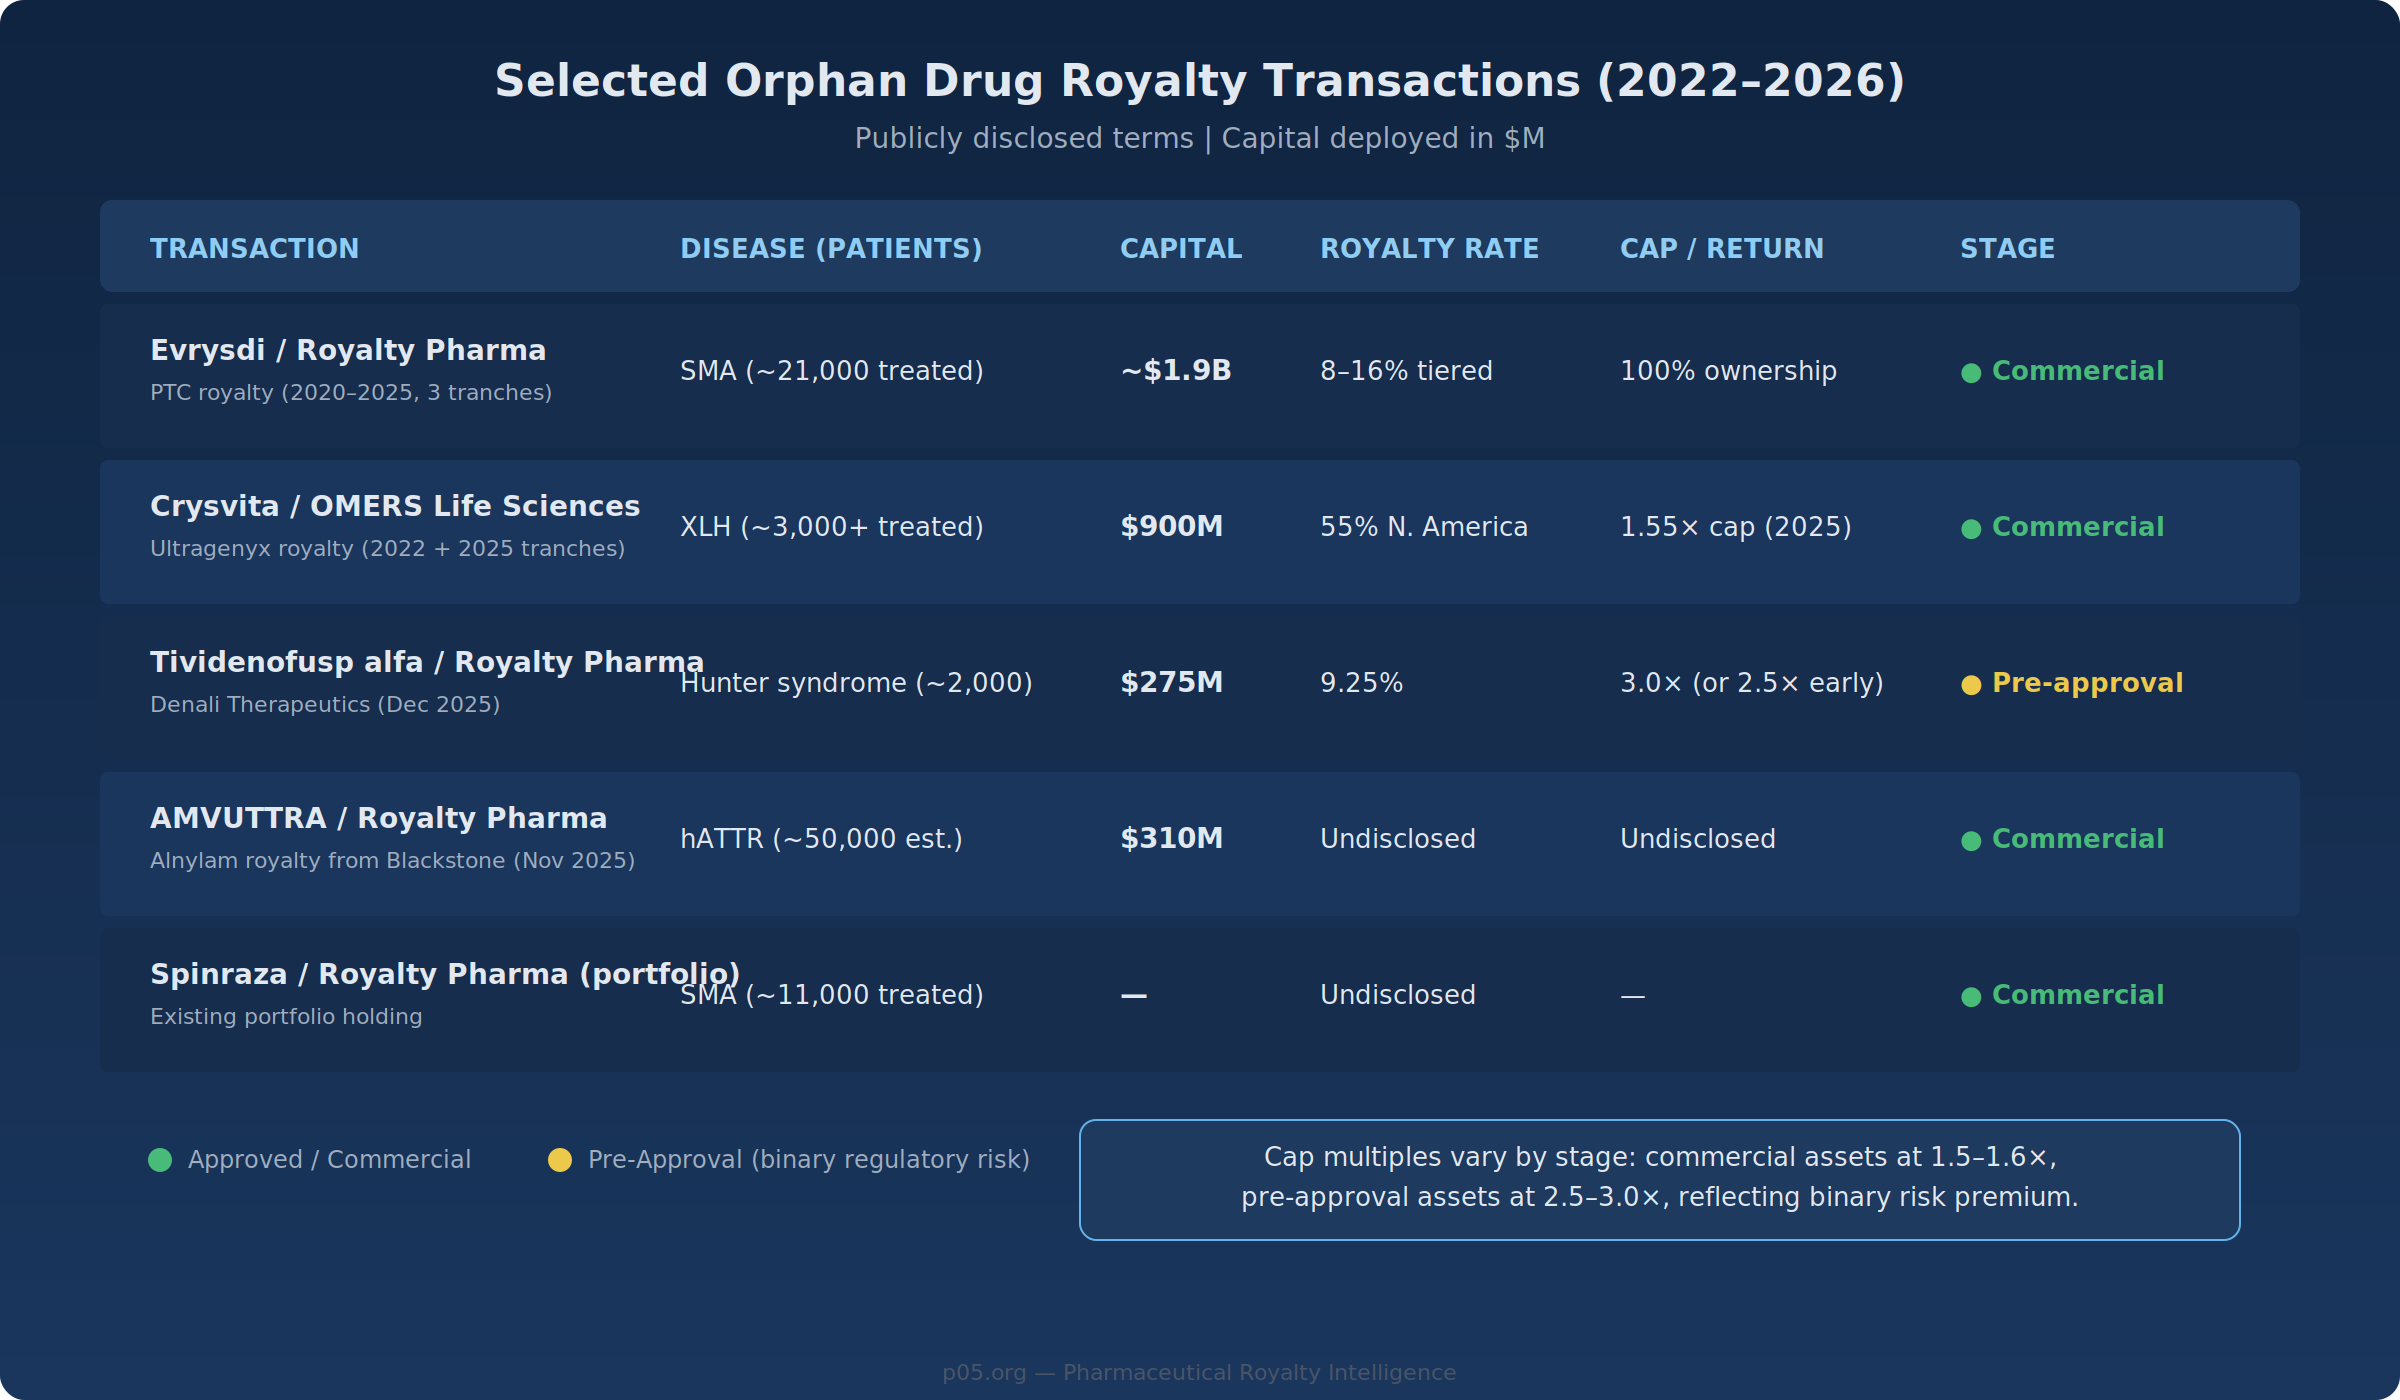
Royalty Pharma pays $200 million at closing (contingent on FDA accelerated approval, PDUFA April 5, 2026) plus $75 million upon EMA approval by December 2029. In exchange, it receives a 9.25% royalty on worldwide net sales, capped at a 3.0× return on funded capital (or 2.5× if achieved before Q1 2039). Hunter syndrome (MPS II) affects approximately 2,000 U.S. patients and ~10,000 globally. The existing standard of care, Takeda's Elaprase (~$700M annual global sales), treats peripheral symptoms; tividenofusp alfa's differentiation lies in CNS penetration.
Assuming full deployment of $275 million and the 3.0× cap, maximum recovery is $825 million, requiring approximately $8.9 billion in cumulative worldwide net sales. The risk is binary—regulatory approval—but once approved, the competitive dynamics of a differentiated therapy in a rare lysosomal storage disorder create a potentially durable cash-flow stream. Whether peak sales reach $1–2 billion annually, as some analysts project, or fall short, depends on the drug's clinical differentiation, pricing, and competitive response from Takeda.
Ultragenyx–OMERS: Crysvita (Burosumab)
In November 2025, Ultragenyx sold an additional 25% of its North American Crysvita royalty to OMERS Life Sciences for $400 million, following a $500 million transaction in 2022 that conveyed 30%. Crysvita is approved for X-linked hypophosphatemia (XLH) and tumor-induced osteomalacia (TIO)—both rare conditions.
The 2025 tranche begins flowing to OMERS in January 2028, capped at 1.55× ($620 million). Crysvita has generated over $4 billion in cumulative North American sales since its 2018 launch, treating over 3,000 patients at annual per-patient costs exceeding $300,000.
The cap structure illustrates how the market prices risk: OMERS accepts a 1.55× multiple on a marketed product with an established sales trajectory, compared to Royalty Pharma's 3.0× on Denali's pre-approval asset. The lower multiple reflects the removal of regulatory binary risk; the higher multiple on the Denali deal compensates for it.
Evrysdi: The $1.9 Billion Consolidation
Royalty Pharma's multi-year assembly of 100% of the Evrysdi royalty—through transactions in 2020 ($650M), 2023 ($1B), and December 2025 ($240M + $60M milestones)—represents the most comprehensive orphan royalty position in the public market.
Total deployed capital: approximately $1.9 billion. The tiered royalty runs from 8% on sales up to $500 million to 16% on sales above $2 billion. With 2024 sales of approximately $1.9 billion growing at 18% annually, and a new tablet formulation approved in both the U.S. and EU in 2025, the blended effective royalty rate is approaching the upper tiers. Analyst consensus projects CHF 2.3 billion (~$2.9 billion) in sales by 2030.
SMA (spinal muscular atrophy) affects approximately 1 in 10,000 births. Evrysdi has treated over 21,000 patients globally. The competitive landscape includes Biogen's Spinraza (declining share, intrathecal administration) and Novartis' Zolgensma (one-time gene therapy, limited to younger patients, peaked at $1.4B in 2022 and declining). Evrysdi's oral administration and broad label have driven market leadership—though the existence of a one-time curative competitor illustrates the gene therapy displacement risk discussed below.
The M&A Dimension: BioMarin–Amicus and the Consolidation Thesis
BioMarin's $4.8 billion acquisition of Amicus Therapeutics, announced in December 2025 and expected to close Q2 2026, illustrates how orphan drug M&A creates and affects royalty opportunities.
Amicus' two marketed products—Galafold (Fabry disease, $458M in 2024 sales, 18% YoY growth) and Pombiliti + Opfolda (Pompe disease)—generated combined revenues of ~$600 million over the trailing four quarters. Galafold's patent litigation settlements extend U.S. exclusivity expectations to January 2037. BioMarin also gains U.S. rights to DMX-200, a Phase 3 asset for the rare kidney disease FSGS.
For the broader royalty market, this transaction signals several things. First, large buyers are willing to pay significant premiums (33% to last close, 58% to 60-day VWAP) for de-risked orphan drug franchises—validating the valuation premiums that commercial-stage orphan royalties can command. Second, BioMarin's shift away from gene therapy (following Roctavian's commercial struggles) toward established enzyme replacement and chaperone therapies reflects what commentators have described as a "flight to quality" in rare disease investing. Third, royalties survive M&A: any existing royalty interest on an acquired product flows through to the royalty holder regardless of corporate ownership changes, making orphan royalties structurally robust to consolidation activity.
Valuation Considerations
Discount Rates
Lower revenue volatility—driven by stable patient populations, limited competition, and pricing durability—can justify a lower discount rate on orphan royalty cash flows compared with mass-market assets. A mass-market royalty portfolio might be discounted at 8–12%; an orphan royalty portfolio, on the same framework, might warrant 6–9%, reflecting reduced probability of material revenue disruption during the exclusivity-protected period. A 3-percentage-point differential on a $50 million annual royalty stream over 15 years produces approximately a 20% NPV difference.
These ranges are illustrative, not prescriptive. The appropriate discount rate depends on the specific asset's competitive position, remaining exclusivity duration, and regulatory status.
Terminal Value
Mass-market drugs typically experience sharp revenue declines upon loss of exclusivity—the "patent cliff." Orphan drugs tend to exhibit a different pattern: generic entry is suppressed by small market size (unfavourable manufacturing economics), regulatory complexity (for biosimilars), and physician reluctance to switch stable rare disease patients. The Health Affairs analysis found that a disproportionately low percentage of orphan drugs faced generic competition immediately after exclusivity expiration.
For royalty models, this suggests the terminal value assumption should incorporate a slower revenue decay curve post-exclusivity—perhaps 5–10% annual decline versus the 70–80% cliff common for mass-market drugs. The impact on NPV is significant, though it remains an assumption that should be stress-tested.
Development Cost Asymmetry
Out-of-pocket clinical development costs for orphan drugs have been estimated at $166 million per approved drug versus $291 million for non-orphan drugs. A royalty investor deploying $200 million against a drug that cost ~$200 million to develop is, in economic terms, co-financing the entire clinical programme. The same deployment against a $500 million mass-market programme represents a smaller fraction of total capital at risk.
Structural Risks
The favourable economics described above do not eliminate risk. Several factors specific to orphan drug royalties deserve careful analysis.
Binary Regulatory Risk
Most orphan royalty transactions involve a single product for a single indication. If tividenofusp alfa fails to win approval, the entire $275 million investment is at risk. Clinical trials in rare diseases typically enrol 20–200 patients, and efficacy endpoints may rely on biomarker surrogates rather than hard outcomes, supporting accelerated approval pathways but introducing confirmatory trial risk.
Mitigation comes primarily at the portfolio level. Royalty Pharma's strategy of assembling positions across 35+ commercial products diversifies away single-asset risk. For smaller royalty investors, the binary nature of individual orphan deals demands disciplined position sizing.
Diagnosis Rate Uncertainty
Revenue models for orphan drugs depend on the rate at which patients are diagnosed and initiated on therapy. Many rare diseases involve diagnostic odysseys averaging 5–7 years. Improvements in genetic screening—particularly expanding newborn screening panels—can materially increase the diagnosed population. SMA's inclusion in the U.S. Recommended Uniform Screening Panel in 2018 meaningfully expanded Evrysdi's addressable market. This dynamic can surprise to the upside, but the timing and magnitude are difficult to model with precision.
Gene Therapy Displacement
The most significant long-term risk to chronic orphan drug royalties is displacement by one-time curative therapies. Zolgensma's 2019 approval for SMA introduced this dynamic in real time: a one-time gene therapy competing against chronic treatment royalties. In practice, gene therapy displacement has been slower and less complete than initially anticipated—manufacturing constraints, limited patient eligibility, durability questions, and reimbursement complexity have all constrained uptake. Zolgensma peaked at $1.4 billion in 2022 and has declined since, while Evrysdi continues to grow.
But the structural risk is real: a royalty stream on a chronic replacement therapy is fundamentally threatened by a curative gene therapy that eliminates the need for ongoing treatment. BioMarin's own experience with Roctavian (haemophilia A gene therapy), which has struggled commercially, suggests the threat is more nuanced than a simple displacement model would imply—but ignoring it entirely is not defensible.
Concentration Risk in Ultra-Orphan
Ultra-orphan drugs—those targeting diseases affecting fewer than 5,000 patients globally—push the orphan model to its extreme. Annual treatment costs of $500,000–$1 million or one-time gene therapy prices of $2–3 million are common. Total addressable markets may be $500 million to $1.5 billion globally. Royalty structures on these assets tend to carry elevated royalty rates (8–12% versus 3–6% for mass-market) and higher cap multiples (2.5–3.0× versus 1.3–1.8×), reflecting both the higher per-patient economics and the concentration risk inherent in single-asset, small-population bets.
The Supply Side: Why Rare Disease Companies Sell Royalties
The orphan drug sector is disproportionately represented among royalty financing transactions, and the reason extends beyond investor demand: rare disease companies are structurally underserved by traditional financing channels. Public equity raises for small-cap biotechs with orphan-focused pipelines are dilutive and frequently available only at significant discounts. Venture debt typically requires revenue or near-revenue assets and often comes with warrants. Bank lending is largely unavailable for pre-revenue biotechs.
Royalty financing fills this gap. PTC Therapeutics' serial monetisation of its Evrysdi royalty—$650 million in 2020, $1 billion in 2023, $240 million in 2025—funded operations and retired debt without issuing additional equity. Ultragenyx's two Crysvita transactions with OMERS ($500 million in 2022, $400 million in 2025) funded product launches while preserving equity value. In January 2026, Royalty Pharma announced up to $500 million in funding for Teva's anti-IL-15 antibody TEV-408—extending the royalty financing model beyond pure-play rare disease biotechs.
Industry data confirms the broader trend: from 2020 through 2024, biopharma royalty financings totalled approximately $29.4 billion, more than double the 2015–2019 period. Surveys suggest nearly 90% of biotech executives are considering a royalty financing within the next three years. Meanwhile, the FDA designated 52% of its 2024 approvals as orphan drugs—the highest proportion on record—expanding the pipeline of potential royalty transactions.
Portfolio Considerations
For royalty funds and institutional investors, orphan drug royalties present a set of characteristics that may warrant differentiated allocation treatment within a broader royalty portfolio.
On the positive side: pricing durability, regulatory moats, lower correlation with mass-market pharmaceutical cycles, expanding deal flow, and a favourable near-term legislative trajectory. On the challenging side: binary approval risk on pre-commercial assets, single-asset concentration, gene therapy displacement risk for chronic therapies, and smaller absolute deal sizes that may limit deployment capacity for large funds.
Whether these characteristics merit an overweight versus orphan drugs' ~20% share of global prescription drug revenues depends on the specific investor's risk tolerance, portfolio construction approach, and ability to manage binary outcomes through diversification. The direction of capital flows suggests the market is increasingly pricing orphan royalties as a structurally distinct sub-asset class—though like any trend, the question is whether current pricing already reflects the structural advantages described above.
Looking Ahead
Several near-term events will test the market's current assumptions about orphan royalties. Tividenofusp alfa's PDUFA date (April 5, 2026) represents the next major binary event for a publicly disclosed orphan royalty transaction. BioMarin's Amicus acquisition (expected Q2 2026) will reshape the rare disease competitive landscape. The Phase 3 ACTION3 trial for DMX-200 (data expected late 2026) could add another high-value orphan asset to BioMarin's portfolio. And Roche's Evrysdi, now with its new tablet formulation available in both the U.S. and EU, continues its trajectory as the largest single orphan royalty position in the public market.
The orphan drug royalty market sits at an inflection point where expanding deal flow, legislative tailwinds, and institutional appetite are converging. Whether this convergence produces attractive risk-adjusted returns or compresses spreads to the point where structural advantages are fully priced depends, as always, on the discipline investors bring to individual transactions.
All information in this article was derived from publicly available sources including company press releases, SEC filings, regulatory announcements, legislative texts, and peer-reviewed publications. Information is accurate as of the research date and may have changed since publication. The author is not a lawyer or financial adviser. This content is for informational purposes only and does not constitute investment, legal, or financial advice.
Member discussion