Pharmaceutical Royalty Structures: A Global Technical Analysis

Executive Summary
In the pharmaceutical industry, royalties serve as a fundamental mechanism for sharing value from intellectual property and products. A royalty typically grants the IP owner a percentage of sales or profits in exchange for allowing another party to use, manufacture, or sell a drug or technology. This comprehensive analysis examines four major royalty structures—licensing royalties, manufacturing partnership royalties, commercialization/distribution royalties, and synthetic royalties—along with their legal frameworks, global variations, and real-world applications.
We explore valuation methodologies including DCF analysis, risk-adjusted NPVs, and securitization approaches, while comparing typical royalty rates across therapy areas, geographies, and development stages. The analysis includes detailed financial modeling approaches, formulas, tables, and risk-adjusted return profiles for both investors and licensors.
Introduction
In the pharmaceutical industry, royalties are a key mechanism for sharing value from intellectual property (IP) and products. A royalty typically grants the IP owner a percentage of sales or profits in exchange for allowing another party to use, manufacture, or sell a drug or technology. This report analyzes four major royalty structures in pharma—licensing royalties, manufacturing partnership royalties, commercialization/distribution royalties, and synthetic royalties—and examines their legal/economic frameworks, global variations, and real-world examples.
We also discuss how to value royalty streams (using DCF, risk-adjusted NPVs, securitization, etc.), compare typical royalty rates by therapy area, geography, and development stage, and evaluate the risk-adjusted return profiles for investors and licensors. Formulas and tables are included to illustrate financial modeling approaches.
1. Licensing Royalties (Out-Licensing of Drugs, Patents & Technology)
How it Works
Licensing is a legal agreement where the owner of a drug or technology (the licensor) grants another company (the licensee) rights to develop, manufacture, and/or commercialize it in a specified territory or field. In return, the licensor receives financial compensation—typically an upfront payment, milestone payments for achieving R&D or regulatory goals, and royalties on sales.
The royalty is usually defined as a percentage of the licensee's net sales of the product, as detailed in PharmAvenue's comprehensive guide and RoyaltyRange's valuation analysis. Royalties align both parties' interests: the licensor's revenue grows with the product's success, while the licensee benefits from exclusive market rights to recoup their investment.
Royalty rates in pharma licenses often use tiered structures (e.g., 8% on the first $100M sales, 12% above that) as described in LESI's analysis of effective royalty rates, to reflect volume or revenue thresholds, rewarding higher sales with higher rates (or sometimes vice versa).
Legally, licensing agreements must delineate the IP scope (patents, know-how, trademarks), exclusivity, territory, term (often until patent expiry plus any extensions), and compliance obligations (e.g., quality standards, reporting, diligence in commercialization).
Economic Mechanisms
In an out-licensing deal, the licensee takes on the development and commercialization costs and risks of the drug, which can be hundreds of millions of dollars, in exchange for the economic upside of product sales. The licensor essentially trades a share of future profits for risk reduction and upfront cash. Royalties typically accrue on net sales (gross sales minus certain deductions like rebates or distribution costs as defined in the contract).
For example, a biotech might license a Phase 2 oncology drug to a big pharma company: the biotech receives, say, $50 million upfront, $500 million in milestones if development and approvals succeed, and a royalty of 10–15% on net sales if the drug reaches market. The licensee then funds expensive Phase 3 trials and marketing. If sales soar to $1 billion/year, the licensor would earn $100–150 million annually (at 10–15% royalty). If the drug fails, the licensor keeps the upfront fees but gets no royalties.
This structure thus shares risk—the licensor's royalty is contingent on success, while the licensee only pays substantial sums if the product generates revenue, as explained in DrugPatentWatch's strategic analysis. Royalties may be flat or tiered; tiered royalties (e.g., escalating with sales) give the licensor a higher share of upside success. Some deals use profit-sharing instead of sales royalties—especially in co-development alliances or where both parties co-promote—but in classic licenses the royalty is on sales revenue.
Global Variations
Licensing practices vary worldwide mainly in deal structures and rate norms rather than legal enforceability (most countries recognize IP licenses similarly).
Major Markets (US, EU, Japan) In major markets, out-licensing is common for both early-stage biotech assets and for companies seeking regional partners. For instance, Western biotechs often license Japan rights to a local pharma—the Japanese partner runs local trials and marketing, paying royalties back to the originator. Royalty rates in such regional deals are often comparable to global deals, though sometimes lower if the partner shoulders heavy development costs or if the market potential is smaller.
Emerging Markets In emerging markets, out-licensing tends to occur for off-patent or mature products: a pharma might license an older drug to a regional company to extend its life. These deals might involve lower royalty percentages or even just supply-price arrangements, given cost sensitivity. In some cases focused on access (e.g., HIV or COVID drugs for low-income countries), originators have granted voluntary licenses at very low or zero royalty.
For example, Gilead licensed generic production of its HIV drugs in India with only a 5% royalty on generics' net sales, and Merck's COVID-19 antiviral molnupiravir was licensed through the Medicines Patent Pool royalty-free during the pandemic, as reported by FiercePharma.
These special cases aside, global licensing deals generally follow similar royalty structures but must account for local factors like pricing/reimbursement and regulatory requirements.
Academic vs Corporate Licensing One notable variation: academic institutions often license early discoveries at lower royalty rates (a median ~3%) compared to deals between companies (median ~8%), reflecting the early-stage nature and higher risk of academic innovations, according to research published in PLOS ONE.
Examples
Dozens of real-world cases illustrate licensing royalties:
Drug Asset License: Shionogi & ViiV (GSK) Shionogi out-licensed its integrase inhibitor HIV drug portfolio (including dolutegravir) to ViiV Healthcare. Shionogi received £35M upfront and milestones, plus an ongoing royalty averaging in the "high teens" (% of net sales), reflecting the high value of a nearly market-ready drug. This high-teens royalty is considerably above the industry median for early-stage deals and indicates the product was late-stage with proven efficacy (dolutegravir was soon approved globally).
Platform Technology License: PCR Technology (Roche & Cetus) Cetus licensed its groundbreaking Polymerase Chain Reaction (PCR) technology to Hoffmann-La Roche in the 1990s. Roche paid a rare $300 million upfront for full rights to PCR, and Cetus also received royalties on product sales using PCR, as documented in TechPipeline's royalty rates analysis. Such a large upfront for a platform shows that beyond royalties, license structures can include substantial lump sums for transformative tech.
University License: University of Michigan & Aastrom Aastrom Biosciences licensed a University of Michigan cell therapy technology for growing blood cells, with a running royalty of only 2% of sales. Similarly, Gilead licensed an antiviral compound from University of Colorado at a 2% royalty. These single-digit royalties are typical for early-stage, unproven IP from academia, where the licensee must invest heavily to develop a commercial product.
Late-Stage/Product License: Antisoma & Abbott (Theragyn) Antisoma licensed a Phase II ovarian cancer radio-immunotherapy ("Theragyn") to Abbott after promising early results. The deal included very high royalties of 20%–30% of sales if the product succeeded. Such a high royalty range, well above industry averages, reflected the asset's advanced status and value. (Ultimately the product did not reach market, underscoring the risk-sharing aspect—Abbott's payoff would justify those royalties only if the drug succeeded).
These examples show that royalty levels are calibrated to the asset's stage and value. Early research licenses may carry only 1–5% royalties, whereas late-stage or market-proven products can command royalties in the teens or higher (sometimes with tiering or profit-split elements for very high sales).
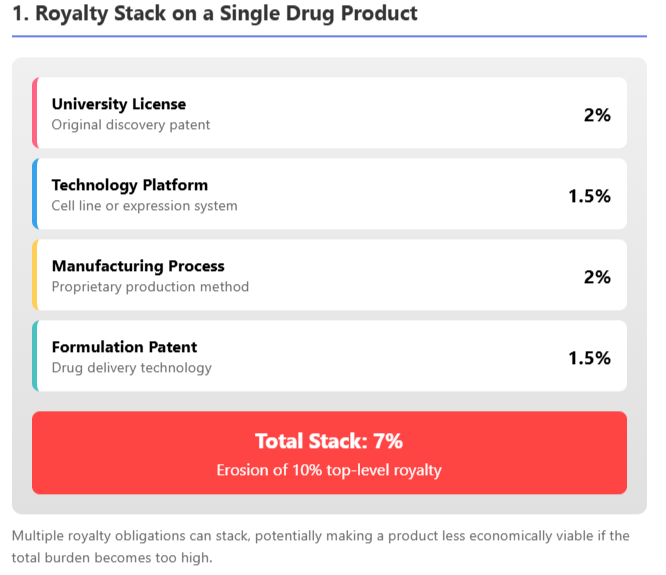
To manage extreme cases, license contracts often have provisions like royalty caps (e.g., royalty drops or ends after a certain sales total or patent expiry) and royalty stacking clauses. A stacking clause limits the licensor's royalty if the licensee has to pay additional third-party royalties; for example, a license might allow the licensee to reduce the royalty by 50% of any third-party payments, ensuring the total "stack" doesn't make the product uneconomical, as discussed in 53biologics' analysis and CELforPharma's exploration.
This is important in fields like biologics where multiple patented inputs might each demand a royalty. As illustrated above, a cumulative royalty burden of ~7% from various technology contributors could substantially eat into a typical 10% royalty deal, so contracts address this by adjusting the primary royalty if needed.
Global Usage
Out-licensing is a core strategy in pharma business development worldwide. In the US and Europe, small biotech firms routinely out-license drugs to larger pharmas for later-stage trials and commercialization, especially in therapy areas like oncology and rare diseases where development costs are enormous. Japan has a long tradition of in-licensing Western drugs for the Japanese market (due to language, regulatory, and market nuances), often involving sizable upfronts and mid-single-digit to low-double-digit royalties.
In China and other emerging markets, recent years have seen a boom in licensing: Western companies license older or secondary products to local firms to tap those markets, and conversely, Chinese biotechs have begun out-licensing globally (e.g., a Chinese company licensing a novel drug to a Western partner), as detailed in ECInnovations' analysis.
Royalty structures remain similar, but local market potential influences the economics. For example, a license of a cancer drug for China might have a lower base royalty but high volume potential, or include a profit-share model if the local partner co-invests in trials. Additionally, government policies (such as price controls or compulsory licensing threats) can indirectly keep royalties in check in some regions.
Overall, licensing royalties are a flexible tool, adapting in rate and structure to the specifics of the deal while adhering to a common legal framework globally.
2. Royalties from Manufacturing Partnerships (Contract Manufacturing Agreements)
How it Works
Not all royalties stem from patents alone—some arise from manufacturing partnerships and technical collaborations. In a contract manufacturing arrangement, a Contract Manufacturing Organization (CMO) or partner produces a drug on behalf of the product owner. Usually, CMOs are paid a straightforward per-unit or cost-plus fee. However, in strategic manufacturing partnerships, especially when proprietary technology or significant know-how is involved, contracts may include royalty or revenue-sharing clauses, as noted in ContractPodAI's analysis.
This means the manufacturer's compensation is tied to the product's sales performance rather than just a fixed price. Such royalty-based manufacturing deals often occur when the manufacturer contributes unique IP (a patented process, a specialized cell line, or formulation expertise) or undertakes risk-sharing in production scale-up.
Legal/Economic Mechanisms
A manufacturing royalty can be structured similarly to a license royalty but focused on the act of manufacturing or supply. For example, a biotech with a novel biologic might partner with a specialized CMO that has a patented cell line or production process. The CMO might license its cell line or process to the biotech for the product, and in return get a royalty on the product's sales (in addition to or instead of standard manufacturing fees).
Economically, this compensates the CMO not just for cost of goods but for the value of their IP or the risk they take in dedicating capacity. It aligns incentives: the manufacturer has reason to maintain quality and efficiency if its revenue depends on product sales.
In other cases, a joint manufacturing venture may be formed where the manufacturing partner effectively becomes a licensee for production. For instance, a company might outsource production to a regional partner who also distributes in that region, sharing profits or paying a royalty back to the IP owner. This often happens if the product owner lacks facilities in a certain geography—the local manufacturer gains the right to make and sell the drug (within that territory) and pays a royalty on those local sales.
Global Variations
Manufacturing royalty deals are common in situations where global supply networks are needed.
Vaccines Domain In the vaccines domain, for example, big pharmas partnered with local manufacturers during COVID-19. AstraZeneca licensed the Oxford COVID-19 vaccine to Serum Institute of India for local production; while initially done at-cost (no royalty) for pandemic relief, such deals can include small royalties once in commercial sale.
Emerging Market Production Licenses Generally, emerging market production licenses (often to increase access) carry nominal royalties. Gilead's approach to expanding access for Hepatitis C and HIV drugs was to license production to qualified generics manufacturers in India and other countries at a low single-digit royalty (often 5% or less). This allowed broad distribution at low cost while still providing the IP owner a modest stream.
High-Margin Biologics Manufacturing In contrast, in high-margin biologics manufacturing, a CMO with proprietary technology might command a royalty even in developed markets. For example, a contract to produce a gene therapy might include a milestone payment and ongoing royalty to the manufacturer if their unique vector production method is critical.
Compulsory Licensing Another global consideration is when a product faces compulsory licensing—a government allowing local manufacture without the originator's consent (e.g., for public health). Under international rules (TRIPS), compulsory licenses mandate payment of "reasonable" royalties to the patent holder, often in the low single digits (on the order of 0.5%–4% in past cases), according to WHO remuneration guidelines. While not a voluntary partnership, this is a form of manufacturing royalty imposed by regulation, varying by country policy.
Examples
Real-world instances of manufacturing-related royalties include:
Technology License for Manufacturing: Cell Line Royalties Biologics manufacturers like WuXi or Lonza often provide biotech clients a proprietary cell line or expression system for production. The deal might be: the biotech pays for development services and agrees to a royalty on future drug sales made with that cell line. This is essentially a manufacturing IP royalty. For example, University-owned cell lines (like HEK or CHO variants) have been licensed out for industrial use with low-single-digit royalties per product. These royalties reward the innovator of the production tech each time a successful drug uses it.
Risk-Sharing CMO Agreement: Cancer Vaccine Manufacturing JV Suppose a small vaccine developer lacks production capability for a personalized cancer vaccine. They partner with a CMO which builds the manufacturing process. Instead of a lump sum fee, the CMO might agree to lower fees upfront in exchange for a X% royalty on sales once the vaccine is marketed. This model was used by some cell therapy companies to entice manufacturing partners to invest in capacity—effectively the CMO acts as an investor, recouped via royalties. (While specific deal terms are often confidential, industry analyses note that "revenue sharing, licensing, or royalty-based arrangements" are part of many pharma–CMO contracts where the CMO's contribution is critical.)
Outsourced Regional Manufacturing: Merck & Indian Generics (Molnupiravir) In 2021, Merck (MSD) allowed Indian generic firms to manufacture the antiviral molnupiravir for 105 low/middle-income countries. The license was royalty-free during the COVID public health emergency, but could require modest royalties if the drug continued post-pandemic. This illustrates a global trend of originators leveraging regional manufacturing partners to scale supply, sometimes foregoing royalties for volume or public goodwill.
Contract Manufacturing plus Distribution: Novartis & Local Distributor A hypothetical but common scenario: Novartis contracts a local pharmaceutical company in Latin America to manufacture and distribute an older portfolio product in that region. The local partner pays Novartis a royalty on net sales in that territory (or transfers product at a fixed transfer price that embeds a royalty margin). In return, Novartis doesn't have to operate a factory or salesforce there. Such deals often have single-digit royalties given thinner margins in emerging markets and the fact that the product may be near-generic.
In summary, manufacturing partnerships with royalties are about leveraging complementary strengths: one party's production expertise and the other's IP. These arrangements are globally used to optimize supply chains. The royalty component transforms a pure vendor relationship into a stakeholding partnership, where both sides benefit from product success. It's worth noting that many CMO contracts remain fee-for-service; royalties come into play primarily when unique IP or market access is contributed by the manufacturer. As the pharmaceutical supply chain globalizes (with different firms handling R&D, production, and marketing), creative royalty structures ensure each contributor can share in the product's financial success.
3. Commercialization & Distribution Royalties (Regional Marketing Partnerships)
How it Works
Pharmaceutical companies frequently form partnerships to market or distribute drugs in specific regions. In such agreements, the rights-holder of a drug grants a regional partner the right to sell or promote the product in a territory (e.g., a smaller pharma gets rights for Latin America or Asia-Pacific markets). The compensation often includes royalties on sales in that region or a revenue/profit-sharing arrangement.
Essentially, this is a form of licensing focused on distribution rights: the partner may not be doing R&D, but they invest in local regulatory approval, marketing, and sales infrastructure. The originator (licensor) benefits by extending its reach without building local operations, and in return takes a royalty or portion of profits.
Legal/Economic Mechanisms
A distribution or commercialization license typically grants exclusive rights to sell the product in the defined territory, often also involving the right to use trademarks and import the product. The legal agreement will specify how the product is supplied (sometimes the originator supplies finished product at a transfer price, or transfers technology for local manufacture, as discussed above).
Royalties in these deals are usually a percentage of net sales in the territory. Alternatively, some deals use a supply-and-profit-share model: the distributor buys product at, say, 50% of the net selling price (effectively a 50/50 profit split after manufacturing cost)—this is economically equivalent to a royalty of 50% of profit.
In more straightforward terms, if a royalty is used, it might range widely depending on the value-add of the distributor. If the local partner is simply a marketing arm, the royalty to the originator could be high (even majority of sales), leaving the distributor a commission-like portion. But if the partner must invest heavily in local trials or adapt the product, the royalty might be more modest (e.g., low double-digits of sales).
Milestone payments are also common in these deals: the regional partner might pay an upfront license fee and milestones for regulatory approvals in the territory or hitting sales targets, as described in DrugPatentWatch's strategic analysis.
Global Variations
The structure of these royalties often depends on market attractiveness and partner capability:
Large, Established Markets In large, established markets (like EU5, Japan, China), regional partnerships can resemble full-fledged licensing deals, with substantial upfronts and competitive royalty rates, because multiple firms may vie for rights. For example, a U.S. biotech could license European rights to a mid-sized EU pharma for ~10–20% royalties on EU sales plus milestones, if the product is novel and in late-stage development.
Japan-specific deals traditionally included sizable upfront payments and single-digit royalties, but as Japanese pharmas globalize, royalties have crept up into low teens for high-value drugs.
Smaller or Emerging Markets In smaller or emerging markets, partners often have lower capacity and deals skew to profit-share rather than high royalties. An originator might accept a lower royalty (or just supply the drug at cost plus a small margin) to enable affordable pricing locally. In these regions, the partner's local know-how is crucial to navigate distribution and regulatory hurdles, so the economic split may favor the partner more than in big-market deals.
Global Health and Access Global health and access also play a role: as mentioned, for essential medicines in low-income countries, originators might use tiered royalties or waive them entirely to ensure distribution. For instance, several multinational companies have regional distribution deals in sub-Saharan Africa at token royalties (or donations schemes), recognizing the limited commercial returns.
Co-Promotion Agreements Co-promotion agreements in major markets are another variant: instead of a simple royalty, companies sometimes agree to share profits in a region. For example, two pharma companies might co-market a drug in the US and split profits 50/50 (after one supplies the product at cost). While not termed "royalty," a profit-split is functionally a royalty on net profit rather than net sales. This typically happens when both companies bring something to the table (one has the product, the other a strong salesforce in a specialty area). Such arrangements are common in oncology and hospital-based products.
Examples
Regional Out-Licensing: AstraZeneca & Sun Pharma (Emerging Markets) AstraZeneca, looking to focus on core products, out-licensed several older branded drugs (for example in the cardiovascular space) to Sun Pharma for India and other emerging markets. Sun gained the rights to market these brands locally, while AstraZeneca received a royalty on Sun's sales of those products. Details are often confidential, but typical emerging-market royalties might be in the single-digit percent range, given these are mature products. The benefit for AstraZeneca was continued revenue from markets it wasn't actively serving, and for Sun, it obtained established brands to sell. (Hypothetical case drawn from common industry practice.)
Japan License: Astellas & FibroGen (roxadustat) The U.S. biotech FibroGen licensed its anemia drug roxadustat to Astellas for Japan (and to AstraZeneca for other regions). FibroGen received an upfront and milestones, and tiered royalties from Astellas on Japanese sales. Public reports indicate royalties in the high teens to low 20% for this late-stage asset in a major market. This showcases how a valuable Phase 3 product can command double-digit regional royalties, approaching profit-share levels (FibroGen's deal is in line with Shionogi's high-teen royalty on a global HIV drug, illustrating that Japan, being a lucrative market, often sees higher royalty deals).
Co-Promotion Profit Split: Merck & Eisai (Lenvima) Eisai (Japan) and Merck formed a co-development and co-commercialization alliance for the cancer drug Lenvima worldwide. In key markets, they agreed to share profits equally (50/50) and co-promote, rather than one paying the other a royalty. Each company also bears 50% of expenses. This is effectively a 50% royalty on net profits to each, instead of a traditional royalty on sales, as documented in PLG Group's analysis. Such arrangements are complex but can maximize both parties' incentives in commercialization.
Distribution Agreement: Biogen & Distributor in Middle East Biogen might contract a local pharmaceutical distributor in the Middle East to sell its multiple sclerosis drug. Biogen supplies the drug and the distributor handles importation, registration, and marketing. The contract could stipulate that the distributor keeps, say, 30% of the sales as their margin, while 70% flows back to Biogen (which can be viewed as Biogen effectively getting a 70% "royalty" on local sales). This high share reflects that the drug is innovative and Biogen as originator commands most of the value, while compensating the distributor for their services.
In all these cases, royalties and revenue shares in distribution deals are about market expansion. They allow companies to tap new geographies and patient populations by leveraging partners. The royalty rates can vary widely—from single digits in modest markets up to large profit-splits in key regions—but generally are lower than full-product licensing because the partner's role, while critical, is more about execution and less about creating the intellectual property value.
These deals must also consider local regulatory differences: e.g., pricing controls might cap profits in one country, so royalty terms might be adjusted (some agreements include clauses to re-negotiate royalty if market conditions change drastically, like a government price cut).
Risk and Reward
For the regional partner, paying royalties reduces risk because they typically do not pay much until sales occur, and they avoid large upfront R&D costs. For the originator, these royalties are almost pure profit (since the partner covers local costs) and extend the product's global reach. The risk to the originator is choosing the right partner—an ineffective distributor could lead to low sales and thus minimal royalties. Contracts often include performance requirements (e.g., minimum sales or promotional spend) or the license can be revoked if the partner underperforms, ensuring the licensor can protect the value of its royalty stream.
4. Synthetic Royalties (Investor-Carved Royalty Streams)
How it Works
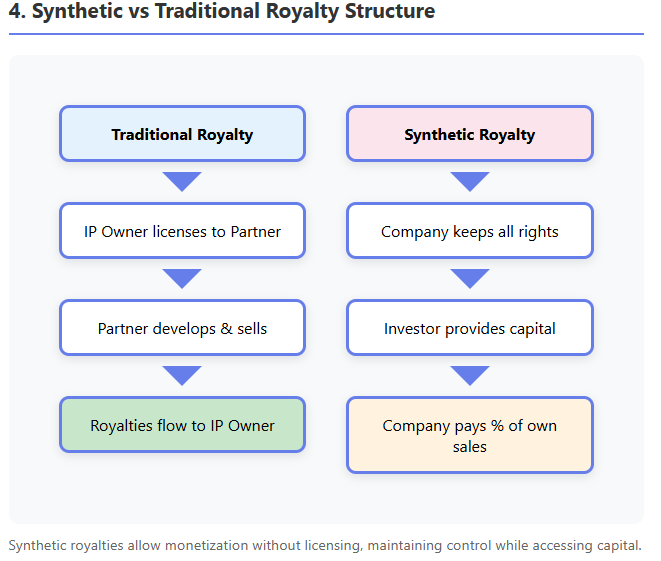
Synthetic royalties are a financial innovation that allows companies to monetize future revenues without an existing third-party license. In a synthetic royalty deal, a company that owns a drug (and is selling it, or plans to) creates a contractual royalty obligation to an investor in exchange for upfront capital, as explained in Covington's comprehensive guide and Avance's analysis.
Unlike traditional royalties which arise from licensing IP to another operator, here the company does not transfer IP or commercialization rights—it continues to sell the product itself—but agrees to pay the investor a percentage of its future sales (or sometimes net revenues) for a defined period. It is termed "synthetic" because it mimics the cash flows of a royalty without an actual out-license; essentially it is a structured revenue-sharing loan.
Legal/Economic Mechanisms
The synthetic royalty is formalized via a Royalty Financing Agreement. Key terms include the royalty rate (the percentage of product sales to be paid), the duration of payments or end date, any caps or return limits, and conditions (e.g., minimum payments, buyout options).
For example, a biotech might agree: "Investor pays $100M now, and we will pay 5% of net sales for 10 years or until the investor has received $200M (2× return), whichever comes first." Here 5% is the synthetic royalty rate, 10 years is duration, and 2× invested capital is a cap on total payout. These deals are designed such that the investor expects a target internal rate of return (IRR) over the period.
Typical synthetic royalty rates are in the mid-single-digits (often 3–10% of sales) and rarely above 10%, as documented in Covington's analysis and Avance's overview, because the company cannot afford to give away too large a share of revenue. To compensate, investors impose caps or longer terms to achieve their return.
A capped royalty means once the investor has received the agreed multiple of their principal (say 1.8× or 2.5×), the payment obligation may end. Often, if the product's sales are lower than forecast and the cap isn't met by the end of term, the agreement might extend or the rate might increase (or a balloon payment may be due) to let the investor reach a minimum return.
Contracts also frequently include buyout (call) options for the company (e.g., the company can pay some defined lump sum to terminate the royalty early) and sometimes put options for the investor (the right to demand early repayment under certain triggers).
Legally, synthetic royalties are structured to survive potential bankruptcy of the company—investors often insist on a "true sale" structure or security interest in the royalty stream. In other words, they may be framed as the sale of an income stream rather than debt, so that even if the company goes bankrupt, the investor's right to X% of sales is separate from the bankruptcy estate. (There is nuance here, and courts may treat some as secured loans, but investors try to optimize for enforceability.)
How It Differs from Other Financing
Synthetic royalty financing is an alternative to traditional debt or equity financing for a company:
Unlike issuing equity, it is non-dilutive—the investor doesn't take shares or ownership, so the company's shareholders don't get diluted, as explained in Covington's guide and Avance's analysis. The cost to the company is only tied to the product's sales, not its overall equity value (if the company does extremely well with other products, the royalty investor has no claim on those).
Unlike debt, there is no fixed principal or interest repayment schedule, as detailed in both Covington and Avance analyses. Payments flex with sales; if sales are low in a quarter, the payment is low. This provides more flexibility and downside protection for the company—if the drug flops, the company isn't stuck with a fixed debt payment (though the royalty agreement might then extend longer or investor's return could be lower). Also, typically no collateral beyond the product's revenue is pledged (or at most the IP itself as security), and there are fewer covenants than bank loans.
Compared to a traditional royalty monetization (where a company sells an existing royalty stream it is receiving from a license), a synthetic royalty is created on a product the company is keeping in-house. As Avance explains, it allows monetizing a product that has no third-party licensee. This is useful for companies that want to retain control of commercialization yet still raise funds.
Effectively, synthetic royalties give an investor a slice of one product's future revenue, isolating risk to that product. The investor's perspective is that of a royalty owner: they perform due diligence on the product's sales potential, patent life, competition, etc., and negotiate a rate and cap that target, say, a mid-teens IRR.
For marketed products with stable sales, investors might accept a lower return (low teens IRR) and thus lower rate or lower cap (perhaps 1.5× over 5–7 years). For riskier pipeline products, investors demand higher return (20%+ IRR), achieved via higher royalty rates and caps (often 2–3× or more of principal if the product is unapproved).
Global Variations
Synthetic royalty financing began primarily in the United States (pioneered by specialist funds like Royalty Pharma, HealthCare Royalty, etc.), but has spread to Europe and other regions as biotech financing needs grew in the 2020s, according to Covington's analysis.
In Europe, these deals are increasingly seen, often necessitating careful tax and legal structuring (treatment can differ: some jurisdictions might treat the royalty payments like debt interest for tax, others as IP royalties). Generally, the concept is global wherever investors are willing to invest in pharma products.
One difference is the interest rate environment: as interest rates rose globally in recent years, the cost of capital for synthetic royalties also rose—deals in 2023–2025 have slightly higher implied royalty rates or caps than those in the low-rate era (investors now seek perhaps 15–20% returns vs 10–15% before).
Another aspect is market focus: synthetic deals typically focus on products with strong IP in major markets (US, EU, Japan), since those sales fund the royalties. An investor might avoid a deal if the product's sales are mostly in countries with uncertain IP protection or reimbursement. However, there are cases of regional synthetic royalties—e.g., a company might do a synthetic deal only on European sales of a drug (carving out that revenue stream) if it wants to raise money specifically tied to EU performance.
Examples
Product Revenue Monetization: Royalty Pharma & Biogen Tysabri Royalty Pharma, an investment fund, executed a semi-synthetic deal for Biogen's multiple sclerosis drug Tysabri. Biogen had bought back some rights from a partner and sought to monetize future sales. In 2017, Royalty Pharma paid Biogen $2.2 billion for the right to a proportion of Tysabri sales: specifically 18% of annual global net sales up to $2 billion, and 25% of sales above $2 billion, in perpetuity. This gave Biogen immediate cash, and Royalty Pharma essentially became the "royalty holder" on Tysabri sales (even though Biogen is selling the drug). This example blurs the line between "existing royalty" and synthetic, but functionally it was a financing secured on future product revenue. Notably, the rates (18–25%) are high, but Tysabri was an established blockbuster—Royalty Pharma's analysis showed those percentages yielded their desired return given Tysabri's projected life cycle and Biogen's buyback conditions.
Synthetic Royalty for Pipeline: Purdue & Enzymotec (Nutrition) Enzymotec, an Israeli firm, entered a synthetic royalty deal for its nutrition products: they received $20M from Purdue Pharma in exchange for paying Purdue a mid-single-digit percentage of future product sales for a term, plus possible milestone kicker. This kind of structure allowed Enzymotec to fund development without giving equity. (This is a generalized example based on press reports; actual terms indicated a ~5% revenue share). It shows that even outside pure "pharma drugs" (here a nutritional supplement), companies can use synthetic royalties to raise cash.
Multiple Synthetic Deals: MicroBiopharma Inc. A hypothetical small pharma with one marketed orphan drug executes two synthetic royalty financings: one with Investor A covering 5% of US sales for 8 years (up to 1.8× return cap), and one with Investor B for 8% of European sales for 10 years (cap 2.0×). This carve-out approach raises funding from two sources, each taking a portion of a different geographic revenue stream. Such splitting is complex but sometimes used to maximize capital (different investors have different market views). It underscores that synthetic royalties are flexible—companies can tailor which product and which markets or indications to include in the royalty base.
Failure Case Protection: Company X Synthetic Buyout Option Company X, a biotech, did a $60M synthetic royalty deal on their cancer drug with a fund. The terms: 6% royalty on global sales for 7 years, minimum payback 1× by year 7, otherwise Company X must pay difference (ensuring the fund doesn't lose principal). The deal also had a buyout clause allowing Company X to terminate the royalty by paying an agreed amount (e.g., $90M) after 5 years. This kind of clause gives the company the option to refinance or buy back the royalty if the drug is very successful (to stop the payments), whereas the investor is protected by the minimum repayment clause. Such features are common—for instance, if sales are slow, a "make-whole" floor might require the company to at least repay the original $60M by the end, as described in Covington's analysis.
The popularity of synthetic royalties has grown as biotech companies seek non-dilutive funding and investors (including pension funds, private equity, and specialized funds) seek steady returns from pharma sales. For investors, synthetic royalties offer bond-like cash flows with biotech upside: relatively stable if the drug is on market, plus growth if sales grow (but also risk if sales fall short). They tend to have low correlation with stock market movements and even an inflation hedge (since royalty payments scale with drug prices, which may rise with inflation).
For companies, the appeal is raising large sums today without giving up control of the product or diluting equity—essentially monetizing a portion of future revenue. However, companies must carefully assess the cost of capital: a synthetic royalty can be expensive if the product becomes a mega-blockbuster (since the company might end up paying far more than the original principal in royalties). Many firms include caps or buy-back rights to limit the long-term cost.
One can view synthetic royalties as "mini-securitizations" of a drug's revenue. In fact, some deals have been literally securitized: the royalty obligations are packaged into notes that investors can buy. There have been cases of royalty-backed bonds—for example, a royalty stream from a portfolio of drugs is bundled and bonds are issued to investors, with the royalty payments funding the coupons. While not common, this shows the intersection of corporate finance and pharma royalties: turning future drug sales into tradable securities. Whether held on a fund's balance sheet or sold as bonds, synthetic royalty streams are ultimately valued on the drug's fundamentals.
5. Valuing and Modeling Royalty Streams
From a financial perspective, royalties in pharma are assets that can be valued using standard techniques, with adjustments for the unique risks (clinical, regulatory, patent expiry) in this industry. Here we outline key financial modeling methods for royalty streams:
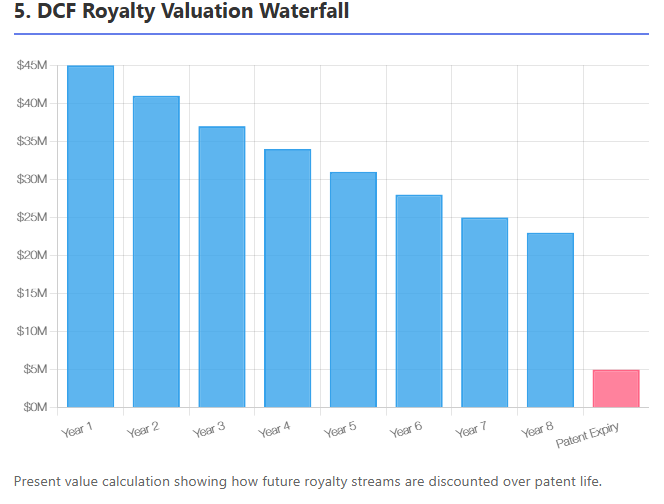
Discounted Cash Flow (DCF) Valuation
The most fundamental approach is to project the future royalty payments and discount them to present value. The formula for the net present value of a royalty stream is:
$$\text{NPV} = \sum_{t=1}^{T} \frac{\text{Royalty}_{t}}{(1 + r)^t}$$
where $\text{Royalty}_{t}$ is the expected cash flow in year t and r is the discount rate. In practice, for a drug royalty, one projects drug sales by year (often until patent expiry or market decline), applies the royalty rate to get royalties, and then discounts.
The choice of discount rate is critical: it should reflect the risk of the royalty stream. For approved, marketed drugs with stable sales, rates might be 8–12%. For developmental or highly uncertain products, much higher rates (15–25%+) are used. The discount rate combines general market risk (time value, economic factors) and idiosyncratic risk of the product (trial failure, competition, etc.), as explained in Partners Group's primer.
Valuation experts often start with a baseline risk-free rate (or swap rate matching the stream's duration) and add a premium for biotech risk. Notably, royalties have finite lives (bounded by patent or contract term), so the cash flow horizon is usually clear (e.g., 10 years or until patent expiry in year 12). DCF is widely used: "The valuation of royalties is typically conducted using a DCF approach, taking into account the entire life of the asset (e.g., until IP expiration for a drug)".
For instance, if a drug has 8 years of patent life left, one would forecast sales for 8 years, apply the royalty rate, maybe assume a decline after patent expiry, and discount those flows.
Risk-Adjusted NPV (rNPV) for Pipeline
When valuing royalties from a drug not yet approved, analysts use risk-adjusted cash flows. This means multiplying future royalties by the probability the drug succeeds to that point. For example, if a Phase 2 drug has a 30% chance to ultimately reach market, then a milestone payment of $50M expected at approval (in 4 years) would be valued at $0.30*50M/(1 + r)^{4}$. Similarly, the royalty stream starting after approval would be scaled by 30% (or more precisely, use stage-by-stage survival probabilities). The sum of these probability-weighted present values is often called expected NPV or rNPV. In formula form, if $P_{t}$ is the probability the drug reaches year t (i.e., hasn't failed in trials), then:
$$\text{rNPV} = \sum_{t} \frac{P_t \times \text{Royalty}_t}{(1+r)^t}$$
This approach explicitly accounts for clinical risk instead of burying it all in the discount rate. A high discount rate might double-count risk if you also multiply by success probabilities, so modelers are careful: one can use a lower risk-free or market discount rate on risk-adjusted cash flows, or a higher discount rate on unadjusted cash flows. Both can be mathematically tuned to yield similar valuations. In pharma, it's common to use industry benchmarks for probability of success at each phase (e.g., 10% Phase 1, 50% Phase 3, etc.) as documented in industry analyses and apply those to cash flows.
Comparable Deals and Benchmarking
Another method (market approach) is looking at comparable licensing deals or royalty transactions. RoyaltyRates™ databases track hundreds of license agreements with disclosed royalty percentages, upfronts, and milestones. By analyzing similar deals (same therapeutic area, drug stage, etc.), one can infer what royalty rate or deal value is "fair."
For instance, if multiple Phase 2 oncology deals command ~10% royalties and $100M upfront, that sets a benchmark for valuing a new similar asset's royalty stream. Investors also look at traded royalties (some royalty funds are public or publish yields). For example, if Royalty Pharma paid 1.8× for a certain drug's royalties, a comparable drug might fetch a similar multiple. This method complements DCF: often one does DCF to estimate NPV, then checks if that implies a sensible multiple of peak sales or compares to known transactions.
Internal Rate of Return (IRR) and Yield Analysis
Especially for royalty financings and synthetic royalties, investors frame the deal in terms of IRR or yield. They will solve for the royalty rate or cap such that:
$$\text{Upfront Paid} = \sum_{t=1}^{T} \frac{\text{Royalty}_t}{(1+\text{IRR})^t}$$
For example, an investor might require IRR = 15%. If the drug's sales forecasts are known, one can back-calculate what royalty rate yields that IRR. This is how many synthetic royalties are priced—iterating on the rate or cap so that the NPV to the investor equals the upfront at the target return. If projections change, IRR is re-evaluated. Many funds have hurdle rates (say 12% for very low-risk assets, 20%+ for riskier) and they structure deals accordingly.
Royalty Securitization Modeling
In a securitization, multiple royalty streams might be pooled. The modeling then involves tranching cash flows and applying default probabilities. For example, if bundling royalties from ten drugs, one might model the portfolio's combined cash flow distribution and determine what fixed coupon could be paid to bondholders with acceptable default risk. This is more complex and uses techniques from structured finance (Monte Carlo simulations, etc.). While beyond the scope of most single-royalty analyses, it's conceptually a further application of DCF: each tranche gets a different effective discount rate based on risk (senior tranche might be low-risk, rated debt; junior equity tranche gets residual).
Milestone Valuation
Upfront and milestone payments are part of most licensing deals and should be included in valuations. In practice, one might break it down: probability of reaching approval × p, milestone X, discount at risk-free then multiply by p, which is similar to using a risk-adjusted rate. The principle is to not overvalue uncertain milestones. If a deal has $100M on approval with ~0.7 probability to get there from Phase 3, the expected value is $70M (before discounting). A licensee would factor that into what they're willing to pay or how they structure royalties (they might accept a higher royalty in exchange for a lower milestone, depending on risk preference).
Option-Pricing Approaches
A more advanced modeling concept treats milestones and royalties as options or contingent claims. For example, the licensee's right to terminate a license in Phase 2 if data are bad can be seen as an option. Or a buyout option in a synthetic royalty has option value. Sometimes, real options analysis is applied to big pharma portfolios to decide licensing versus internal development. However, most deal practitioners use scenario analysis and DCF rather than formal option pricing models, because drug development isn't easily encapsulated in risk-neutral pricing frameworks (risks are mostly idiosyncratic).
In financial models prepared for royalty deals, analysts often include sensitivity analysis: how does the NPV change if sales are 20% lower or higher, if launch is delayed by 2 years, if discount rate ±2%, etc. They also consider breakeven scenarios (what peak sales does the investor need to just get their money back by X year?). This helps in negotiations—e.g., a biotech might realize that at a 5% royalty rate, if sales hit the aggressive forecast, the investor would make 3× money, which might be too much; that might prompt a cap in the contract.
In summary, valuing a royalty is about forecasting the cash flows (sales), then applying the right risk adjustments (probabilities, discount rates). Unlike a whole company valuation, there is no terminal value beyond the patent/exclusivity period (except perhaps a negligible tail if generics still pay some royalties on know-how, which is rare). Thus, royalty models naturally capture the finite life of pharma assets.
Table 1: Typical Royalty Valuation Inputs
| Valuation Input | Consideration |
|---|---|
| Sales forecast | Use market size, penetration, growth, price erosion after patent. Scenario cases (base/upside/downside). |
| Royalty rate & tiers | Apply contract terms (e.g., 5% up to $500M sales, 8% above). If tiered, model each tier portion separately. |
| Duration of royalty | Patent expiry (or biologics exclusivity), any tail period. Sometimes royalties persist a few years post-patent (or taper down) if stipulated. |
| Discount rate (r) | Reflect risk: higher for early-stage or if sales forecast is uncertain. Often use WACC or target IRR for similar assets as guide. |
| Probability of success | For pipeline assets, apply success probabilities by phase (e.g., Phase 3 ~60–70% success to approval on average). Adjust if asset is in a higher-risk or less-proven class. |
| Milestones | List each milestone with estimated timing and probability. Discount each to PV. E.g., Phase 3 start $20M (90% chance Phase 2 succeeds?), approval $100M (p=overall success). Sum into NPV. |
| Competitive landscape | Incorporate potential early loss of sales to competitors or generics (could model an earlier drop-off in sales, or adjust probability of peak sales). |
| Patent/legal risk | If key patents are under challenge, consider a scenario where royalty ends early or settlement reduces rate. Possibly adjust discount rate upward. |
| Residual rights | If contract has buyout options or residual rights (e.g., licensee can continue selling royalty-free after certain payments), account for those truncating cash flows. |
| Currency & inflation | If royalties are in multiple currencies, model FX or use real vs nominal growth. Royalties can hedge inflation as they rise with drug price, but price controls can cap that. |
Using these inputs, analysts produce metrics like NPV, IRR to investor, payback period, and often royalty yield (annual royalties / upfront payment, in %). For instance, a $100M upfront that yields $15M royalties per year on average corresponds to a 15% yield (though the yield will fluctuate with sales). Comparisons to bonds or other assets are made: a stable drug royalty might be considered similar to a high-yield bond but with some growth potential if sales expand.
6. Typical Royalty Rates and Deal Benchmarks
Royalty rates in pharma vary widely. Key factors are the stage of development, therapy area, and market dynamics. Drawing on industry data from the last decade, we can outline some general benchmarks:
By Development Stage
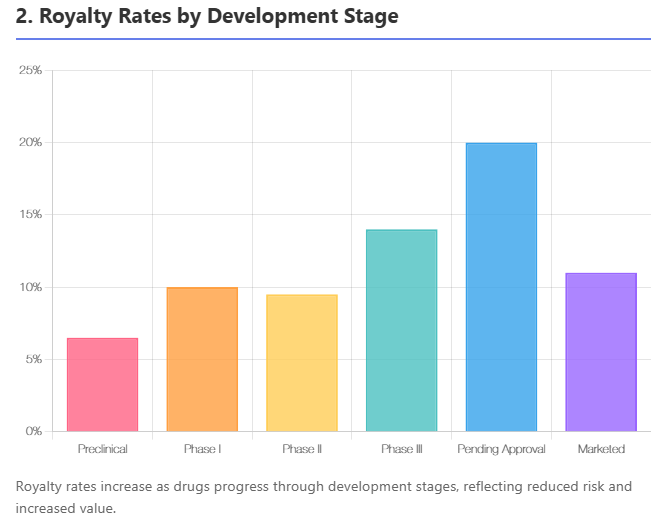
Earlier-stage projects command lower royalties, later stages higher, as the licensor has added more value by derisking the asset. One large analysis of ~1,200 licensing deals found that the average preclinical royalty was about 8% of sales, while deals at Phase III averaged around 14%. For products on the cusp of approval ("pending approval" stage), royalties spiked to the 20%+ range (average ~21%), since the asset is nearly de-risked but the licensee will still invest in launch.
Conversely, for Phase I–II assets, typical royalties are single-digit to low-teens (in that dataset, Phase II avg ~9.5%, slightly lower than Phase I's 10% due to an outlier). Once a product is marketed, licensing it to another company might actually involve lower royalties (~12% average in the analysis), because much of the value is already realized (the licensee is often taking on a mature product in a competitive market).
Table 2: Typical Royalty Rate Ranges by Stage
| Stage | Typical Royalty Rate (% of sales) |
|---|---|
| Research/Preclinical | 2% – 8% (avg ~5–8%) |
| Phase I | 5% – 10% (avg ~10%) |
| Phase II | 5% – 12% (avg ~9–10%) |
| Phase III | 8% – 15% (avg ~14%) |
| Pending Approval | 10% – 20+% (avg ~20%) |
| Marketed (post-approval deals) | 5% – 15% (avg ~10–12%) |
(Sources: MedTrack/BioMedTracker analysis of deals 2003–2012; TechPipeline examples. Actual deals vary; tiered structures common.)
These ranges are not absolute rules but illustrate the trend: as risk diminishes, licensors can negotiate a higher share of the economics. However, note that the total deal economics also include upfront and milestones which tend to have the opposite timing (big upfront for late-stage deals vs small upfront early). So a Phase I deal might be "low royalty, low upfront," whereas a Phase III deal is "high royalty, high upfront." If a licensor forgoes an upfront, they might push for a higher royalty to compensate (and vice versa).
By Therapy Area
Royalties also differ by therapeutic area, reflecting market size, competition, and development cost. In the MedTrack analysis, ophthalmology deals had the lowest mean royalty (~7.3%), whereas genitourinary (e.g., urology, reproductive health) were highest (~15.3%). Oncology, CNS, etc., fell in between.
One reason is that some fields like ophthalmology had many early-stage deals (hence lower royalties and more risk), while genitourinary deals tended to be later-stage or with strong niche markets (hence higher royalties). Additionally, the availability of alternatives plays a role: for instance, anti-infectives might have lower royalties if there are many generic or alternative therapies, whereas a unique orphan disease drug (common in genitourinary or endocrine disorders) can justify higher royalty.
The data showed oncology licensing deals are very frequent (largest number of deals) and had a wide range, often clustering in single-digits to low-teens (many oncology deals are early stage). Cardiovascular and diabetes often had moderate single-digit royalties in deals, partly because those markets are huge but also cost-intensive (licensees might insist on lower royalties due to massive Phase 3 trial costs).
Orphan diseases (which could span multiple categories) often see double-digit royalties because of high pricing and lower marketing cost (partners can afford a bigger share to licensor). In practice, each deal is unique, but a licensor can benchmark: e.g., gene therapy deals in rare disease in 2020s often see mid-teens to 20% royalties (since they are usually post-proof-of-concept and very high-priced products), whereas an antibiotic in early development might only get a 5% royalty offer (smaller market, higher risk).
Table 3: Example Royalty Rate Averages by Therapy (from MedTrack data)
| Therapy Area | Mean Effective Royalty (%) in Deals |
|---|---|
| Ophthalmology | ~7% (lowest) |
| Oncology | ~10% (large range of 1–15% common) |
| CNS/Neurology | ~10–11% |
| Infectious Disease | ~11% |
| Cardio/Metabolic | ~9–10% |
| Genitourinary | ~15% (highest average) |
| Others (Derm, Respiratory, etc.) | ~8–12% depending on specifics |
(Note: These are historical averages; individual deal terms vary. "Mean effective royalty" takes into account tiered structures by calculating total royalties / total sales in the deal model.)
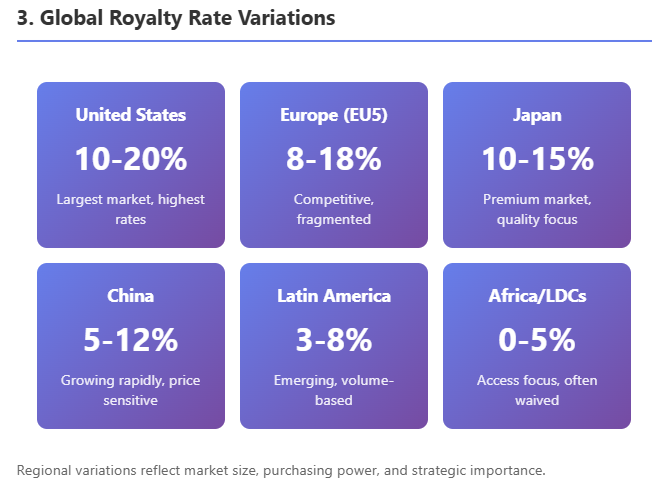
By Geography/Market
While royalties are mostly determined by asset value rather than geography, there are some patterns. Licenses for U.S. rights (when a non-U.S. company licenses to a U.S. partner) often feature higher royalties than those for smaller countries, simply because the U.S. market can support more. A deal solely for China rights historically had lower royalties (e.g., low-single-digits to mid-single-digits) with higher upfront relative to that market's size, since until recently many Chinese deals were for older drugs or China was considered a "bonus" market. This is changing as China's market grows—now innovative drug licenses in China can see high-single or low-double-digit royalties if the licensee is getting a blockbuster for China, as documented in ECInnovations' analysis.
Europe-only licenses typically range similar to U.S. deals but maybe slightly lower if the U.S. was already gone (the remaining EU market is somewhat smaller and more fragmented). Also, worldwide vs regional: if a license is global, the royalty might be a blended rate. If a licensor carves out small markets to license separately, those deals might individually have lower rates (the big licensee who took U.S./EU wouldn't want to pay high royalties and then see the licensor also get high royalties from rest-of-world partners that piggyback on their work—often the primary licensee will sub-license smaller regions at a modest royalty split).
Therapy vs Stage Interaction
Some therapy areas have systematically higher or lower royalties after adjusting for stage. For example, oncology often has slightly lower royalties than one might expect for late-stage assets because competition is fierce (licensees argue they need more margin to compete in a
Member discussion