Pie-Crust Promises: The $95 Billion Gap Between Biotech Biobucks and Reality (2023-2025)
Biotech deal announcements routinely trumpet eye-catching "biobucks" figures—billions promised in future milestone payments if all goes well. Yet few of those contingent dollars ever materialize. Between 2023 and 2025, the industry saw a striking gap between milestones announced and milestones achieved, as most clinical and regulatory milestones proved to be pie-crust promises: easily made, easily broken.
This analysis dives into the hard data behind global milestone payments triggered in biotech and pharma deals, examining the numbers by phase, geography, deal type, and therapeutic area. It reveals why the vast majority of these payments remain elusive and what that means for dealmaking strategy.
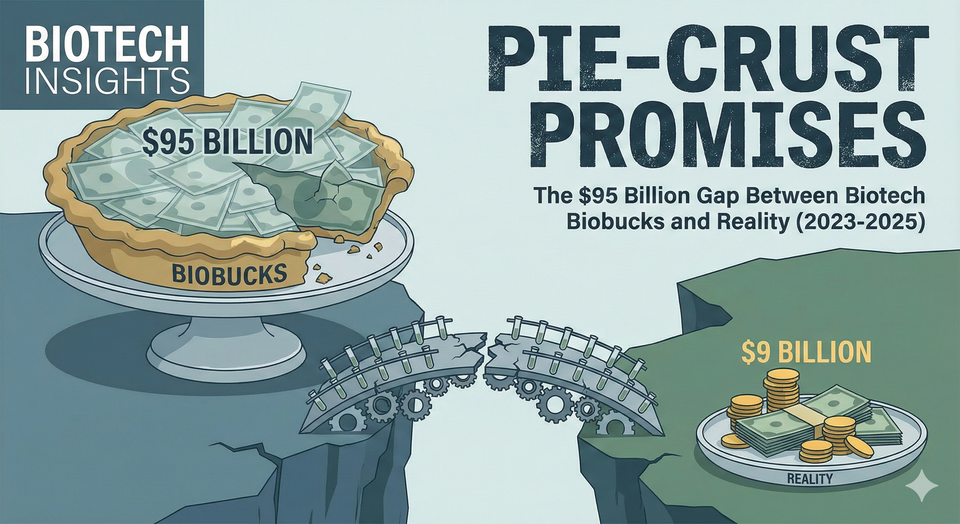
The Biobucks Illusion: $95 Billion Promised, $9 Billion Paid
When a licensing or M&A deal is signed, companies routinely tout the total deal value—a sum of upfront cash plus every possible milestone payout. In practice, those headline numbers are largely an illusion. Industry veterans aptly dub them "Monopoly money," reflecting that only a fraction ever converts to real cash.
According to SRS Acquiom's 2025 analysis, of all the contingent milestone value built into life sciences deals since 2008—a whopping $95.1 billion worth of biobucks across 342 tracked deals—only about $9 billion had actually been paid out by mid-2025. That's a mere 9.5% realized. In other words, over 90% of milestone dollars dangled in deals ultimately never get delivered.
| Metric | Value |
|---|---|
| Total earnout potential tracked (2008-2025) | $95.1B |
| Total actually paid | $9.0B |
| Overall payout rate | 9.5% |
| Biopharma-specific payout rate | 19% |
| Milestone events achieved (2023) | 22% |
| Deals paying zero milestones | 45% |
This gap between promise and reality has only marginally improved despite recent deal flurries. Two years prior, the payout rate was about 9.0%, so 9.5% represents a 0.5% uptick—progress measured in decimal points. Even when we isolate biopharma drug deals, which tend to have higher success rates than devices or diagnostics, only roughly 19% of the contingent payments tied to deals have been paid. The rest evaporated as pipeline programs faltered.
The 2023-2025 League Tables: Announced vs. Reality
Big Pharma M&A Scorecard (2023-2025)
The following table ranks major pharma acquirers by their 2023-2025 deal activity, showing the gap between announced values and actual/expected milestone payments.
| Rank | Acquirer | Total Announced Value | Upfront Paid | Milestones/CVR Potential | Milestones Paid to Date | Effective Payout Rate |
|---|---|---|---|---|---|---|
| 1 | Pfizer | $61.3B | $61.3B (100%) | $0 | N/A | 100% (all-cash) |
| 2 | Merck | $23.7B | $23.7B (100%) | $0 | N/A | 100% (all-cash) |
| 3 | AbbVie | $19.0B | $18.8B | $75M CVR | $1.6B (licensing) | 99%+ |
| 4 | Bristol-Myers Squibb | $30.3B | $22.9B | $7.4B | $0 (Celgene CVR expired) | 76% |
| 5 | Novartis | $8.2B | $7.1B | $1.05B | $160M (Chinook CVR) | 89% |
| 6 | AstraZeneca | $4.7B | $3.8B | $900M | $0 (all pending) | 81% |
| 7 | Johnson & Johnson | $16.6B | $16.6B | $2.35B (Auris) | -$1.1B (judgment against) | N/A |
| 8 | Eli Lilly | $3.2B+ | $2.5B+ | $700M+ | Pending | ~78% |
| 9 | Sanofi | $2.2B | $1.9B | $330M CVR | Pending | 86% |
Key Insight: Pfizer and Merck have entirely avoided milestone structures in major deals, paying 100% upfront. BMS carries the largest unrealized milestone exposure due to the Celgene CVR catastrophe.
Bristol-Myers Squibb: The Celgene CVR Disaster
| Deal | Year | Announced Value | Upfront | CVR/Milestones | Status | Milestones Paid |
|---|---|---|---|---|---|---|
| Karuna Therapeutics | 2024 | $14.0B | $14.0B (100%) | None | COBENFY approved Sep 2024 ✓ | N/A |
| RayzeBio | 2024 | $4.1B | $4.1B (100%) | None | Phase 3 ongoing | N/A |
| Mirati Therapeutics | 2024 | $5.8B max | $4.8B | $1.0B CVR | MRTX1719 NDA by 2031 | $0 (pending) |
| Celgene | 2019 | $74B + $6.4B CVR | $74B | $9/share CVR | EXPIRED WORTHLESS | $0 |
The Celgene CVR failure remains the industry's cautionary tale. The $74 billion acquisition included a CVR paying $9/share (approximately $6.4 billion total) contingent on FDA approval of three drugs by December 31, 2020: ozanimod, liso-cel, and ide-cel.
Timeline of Destruction:
| Date | Event | CVR Trading Price |
|---|---|---|
| Nov 2019 | CVRs begin trading | $2.26 |
| Mar 2020 | Ozanimod approved ✓ | $4.51 |
| May-Dec 2020 | COVID delays Lonza facility inspections | Declining |
| Dec 31, 2020 | Liso-cel misses deadline | $0.69 |
| Jan 1, 2021 | All CVRs terminate worthless | $0.00 |
| Feb 5, 2021 | Liso-cel approved (36 days late) | N/A |
| 2021-2025 | Litigation ongoing | $6.7B+ potential liability |
COVID-19 travel restrictions prevented an FDA manufacturing inspection at Lonza's Texas facility, directly causing the delay. The CVR required all three approvals—one miss killed the entire structure.
Pfizer: The All-Cash Champion
| Deal | Year | Value | Structure | Status |
|---|---|---|---|---|
| Seagen | 2023 | $43.0B | 100% cash | Largest pharma deal since AbbVie/Allergan |
| Arena Pharmaceuticals | 2022 | $6.7B | 100% cash | VELSIPITY approved Oct 2023 ✓ |
| Biohaven | 2022 | $11.6B | 100% cash | NURTEC commercial success ✓ |
| Total | $61.3B | 100% upfront | Zero milestone complexity |
Pfizer's strategy demonstrates a clear preference for 100% all-cash structures in major acquisitions. The company committed $31 billion in new debt plus $8 billion in commercial paper to fund Seagen—a bet on ADC technology rather than contingent payments.
Merck: All-Cash, All Wins
| Deal | Year | Value | Structure | Outcome |
|---|---|---|---|---|
| Prometheus Biosciences | 2023 | $10.8B | 100% cash | TL1A program in Phase 3 |
| Acceleron | 2021 | $11.5B | 100% cash | WINREVAIR approved Mar 2024 ✓ |
| Imago BioSciences | 2023 | $1.35B | 100% cash | Bomedemstat in Phase 2/3 |
| Total | $23.7B | 100% upfront | Zero milestone risk |
Merck's Acceleron acquisition stands as a validation case: sotatercept (WINREVAIR) secured FDA approval for pulmonary arterial hypertension in March 2024, with Q3 2024 sales reaching $149 million and peak estimates of $2-4 billion annually.
AbbVie: High Upfronts, Mixed Results
| Deal | Year | Announced | Upfront | CVR | Outcome |
|---|---|---|---|---|---|
| Cerevel Therapeutics | 2024 | $8.7B | $8.7B (100%) | None | Emraclidine FAILED Phase 2 (Nov 2024) |
| ImmunoGen | 2024 | $10.1B | $10.1B (100%) | None | ELAHERE full approval ✓ |
| Landos Biopharma | 2024 | $212M max | $137.5M | $75M CVR | CVR pending |
| Milestones Paid (Licensing) | 2024 | — | — | — | $1.6B paid |
AbbVie's Cerevel acquisition illustrates acquisition risk even in all-cash deals. Emraclidine—the lead asset and primary acquisition rationale—failed both Phase 2 EMPOWER trials in November 2024, missing primary endpoints for schizophrenia treatment.
However, AbbVie stands out for actually paying licensing milestones: $1.6 billion in 2024 with an additional $248 million expected in 2025.
Novartis: CVR Success and Setbacks
| Deal | Year | Announced | Upfront | CVR | Status | Paid |
|---|---|---|---|---|---|---|
| Chinook Therapeutics | 2023 | $3.5B | $3.2B | $300M CVR | Atrasentan approved Apr 2025 | $160M ✓ |
| Mariana Oncology | 2024 | $1.75B | $1.0B | $750M | Pending | $0 |
| IFM Due | 2024 | $835M | ~$92M (11%) | $743M (89%) | Pending | $0 |
The Chinook CVR represents a rare success story: Novartis paid $160 million upon atrasentan's FDA approval in April 2025—one of the few CVRs to actually trigger.
AstraZeneca: The CVR-Heavy Acquirer
| Deal | Year | Upfront | CVR | Total | Deadline | Status |
|---|---|---|---|---|---|---|
| Fusion Pharmaceuticals | 2024 | $2.0B | $400M | $2.4B | Aug 2029 | Pending |
| Gracell Biotechnologies | 2024 | $1.0B | $200M | $1.2B | Regulatory | Pending |
| Icosavax | 2024 | $0.8B | $300M | $1.1B | Regulatory + sales | Pending |
| Total | $3.8B | $900M | $4.7B | $0 paid |
AstraZeneca consistently uses CVRs representing 15-25% of total deal value, all tied to regulatory milestones. All three 2024 CVRs remain pending.
Johnson & Johnson: From Payer to Defendant
| Deal | Year | Upfront | Milestones | Outcome |
|---|---|---|---|---|
| Legend Biotech (partnership) | 2017+ | $350M+ | Ongoing | $375M+ paid ✓ (CARVYKTI: $963M 2024 sales) |
| Ambrx Biopharma | 2024 | $2.0B | None | 100% cash |
| Auris Health | 2019 | $3.4B | $2.35B | $1.1B JUDGMENT AGAINST J&J |
The Auris Health judgment represents the largest earnout damages award in Delaware history. The court found J&J ran an internal competition ("Project Manhattan") pitting Auris technology against its own products, systematically avoiding milestone payments.
CVR Performance Database: A Decade of Broken Promises
Complete CVR Outcomes (2011-2025)
| Acquirer/Target | Year | Face Value | Trigger | Deadline | Final Outcome | Payout |
|---|---|---|---|---|---|---|
| BMS/Celgene | 2019 | $9.00/share | 3 FDA approvals | Dec 2020 | Expired worthless | $0 |
| Sanofi/Genzyme | 2011 | Up to $14/share | Lemtrada approval + sales | Various | Settled via litigation | ~$0.88/share |
| Alexion/Syntimmune | 2018 | $800M total | 8 dev milestones | 7 years | Litigation award | $310M+ |
| Novartis/Chinook | 2023 | $300M | FDA approval | 2025 | Paid | $160M |
| AZ/Fusion | 2024 | $3.00/share | Regulatory | Aug 2029 | Pending | TBD |
| Radius Health | 2022 | $1.00/share | $300M TYMLOS sales | Dec 2025 | Deadline imminent | TBD |
| J&J/Abiomed | 2022 | Up to $35/share | Class I guidelines | Dec 2029 | Pending | TBD |
| Sanofi/Inhibrx | 2024 | $5.00/share | FDA approval | Jun 2027 | Pending | TBD |
| Lilly/Verve | 2024 | $3.00/share | Phase 3 dosing | 10 years | Pending | TBD |
CVR Payout Statistics
| Outcome Category | Count | Percentage |
|---|---|---|
| Paid in full | 4 | 13% |
| Partial payment/settlement | 6 | 20% |
| Expired worthless | 20 | 67% |
| Total resolved | 30 | 100% |
According to Cleary Gottlieb's analysis of 65 biopharma CVR deals, among 30 with resolved outcomes, only 4 (13%) paid in full and 6 (20%) made partial payments. The remaining two-thirds expired worthless.
CVR Usage Surge
| Year | CVR Deals | % of Total Deals | Avg CVR as % of Deal Value |
|---|---|---|---|
| 2020-2021 | <10 | <5% | 15-20% |
| 2022 | 9 | ~8% | 15-20% |
| 2023 | 18-20 | 38% | 20-25% |
| 2024 | 7 | 22% | 25-30% |
| 2025 YTD | 27 | Record | 37% |
Milestone Achievement Rates: The Phase-by-Phase Reality
Achievement by Development Stage
| Phase | Achievement Rate | Typical Payment | $ Missed (Est.) |
|---|---|---|---|
| Preclinical (IND filing) | 61% | $5-15M | Low |
| Phase 1 completion | 32% | $5-20M | Moderate |
| Phase 2 completion | 20% | $15-40M | High |
| Phase 3 completion | 15% | $50-150M | Very High |
| Regulatory (FDA approval) | 11% | $75-200M | $12.1B+ |
| Commercial ($100M sales) | 10-15% | $10-25M | High |
| Commercial ($500M sales) | 5-8% | $25-75M | Very High |
| Commercial ($1B+ sales) | 3% | $50-150M | Highest |
Source: SRS Acquiom, BIO/Informa
Key finding: Of approximately $25 billion in commercial milestone potential tied to $1B+ sales thresholds, virtually none is expected to pay out based on the 3% historical achievement rate.
Achievement by Therapeutic Area
| Therapeutic Area | Overall LOA* | Phase 2→3 Success | Implied Milestone Risk |
|---|---|---|---|
| Hematology | 23.9% | 48.0% | Lowest |
| Rare Disease | 17.0% | 44.6% | Low |
| Metabolic/Obesity | 15.5% | 45.0% | Low-Moderate |
| Infectious Disease | 13.2% | 38.4% | Moderate |
| Immunology | 10.7% | 31.4% | Moderate-High |
| Psychiatry | 7.0% | 27.0% | High |
| CNS/Neurology | 5.9% | 26.8% | High |
| Oncology | 5.3% | 24.6% | Highest |
| Cardiovascular | 4.8% | 21.0% | Highest |
*Likelihood of Approval from Phase 1. Source: BIO/Informa Clinical Development Success Rates
Oncology dominates deal volume but has among the lowest clinical success rates. This explains why the industry generates massive biobucks announcements (oncology accounts for 40%+ of deals) but sees relatively few payouts.
China-to-West Deals: $41 Billion in Promises, Mixed Results
The China licensing wave generated enormous biobucks headlines—but outcomes have been sharply divergent.
China Deal League Table (2023-2025)
| Rank | Chinese Company | Western Partner | Announced Total | Upfront | Milestones Paid | Status |
|---|---|---|---|---|---|---|
| 1 | Innovent Biologics | Takeda | $11.4B | $1.2B | $0 | New (Dec 2025) |
| 2 | Hengrui Medicine | GSK | $12B+ | Undisclosed | $0 | Pending |
| 3 | Hansoh Pharma | GSK | $3B+ | Undisclosed | $0 | ADCs advancing |
| 4 | BeiGene | Novartis | $650M+ | $650M | $0 | TERMINATED |
| 5 | Innovent Biologics | Eli Lilly | $1B+ | $200M | $0 | TERMINATED |
| 6 | Legend Biotech | J&J/Janssen | $350M+ ongoing | $350M | $375M+ ✓ | CARVYKTI success |
| 7 | HUTCHMED | Takeda | $1.13B | $400M | ~$70M+ ✓ | FRUZAQLA success |
Deal Failures: What Went Wrong
Innovent/Eli Lilly (Terminated October 2022)
| Metric | Detail |
|---|---|
| Asset | Sintilimab (PD-1 inhibitor) |
| Upfront paid | $200M |
| Milestone potential | $825M |
| Milestones received | $0 |
| Failure reason | FDA rejected China-only pivotal data |
BeiGene/Novartis (Terminated September 2023)
| Metric | Detail |
|---|---|
| Asset | Tislelizumab (PD-1 inhibitor) |
| Upfront paid | $650M |
| Milestone potential | $650M+ additional |
| Milestones received | $0 |
| Failure reason | "Changing PD-1 inhibitor landscape" |
| Outcome | BeiGene launched independently; Tevimbra FDA approved Mar 2024 |
Deal Successes: What Worked
Legend Biotech/J&J (Ongoing)
| Metric | Detail |
|---|---|
| Asset | Cilta-cel (CAR-T, CARVYKTI) |
| Milestones paid | $375M+ |
| 2024 sales | $963M |
| Patients treated | 5,000+ |
| Status | Approaching blockbuster |
HUTCHMED/Takeda
| Metric | Detail |
|---|---|
| Asset | Fruquintinib (FRUZAQLA) |
| Milestones paid | ~$70M+ (including $20M commercial milestone) |
| 2024 sales | $290M |
| Approvals | US (Nov 2023), EU (Jun 2024), Japan (Sep 2024) |
China Deal Volume Surge
| Year | China-to-West Deals | Total Value | Share of Global Biotech Licensing |
|---|---|---|---|
| 2023 | 45+ | $16.6B | 24% |
| 2024 | 60+ | $41.5B | 28-31% |
| 2025 Q1 | 25+ | $15B+ | 32% |
Source: Pharmaceutical Technology, Nature Reviews Drug Discovery
Earnout Litigation: $1 Billion Judgments Reshape Dealmaking
Delaware Court of Chancery rulings in 2024-2025 fundamentally changed earnout risk calculations.
Major Litigation Outcomes
| Case | Disputed Amount | Winner | Award | Precedent Set |
|---|---|---|---|---|
| J&J/Auris Health | $2.35B | Seller | $1.1B+ | Internal competition = breach |
| Alexion/Syntimmune | $800M | Seller | $310M+ | "Outward-facing" CRE standard |
| Medtronic/Companion | $100M | Buyer | Dismissed | "Complete discretion" protects buyer |
| Cephalon/Ception | Unknown | Buyer | N/A | Subjective standard favors buyer |
| BMS/Celgene CVR | $6.4B+ | Pending | TBD | Diligent efforts under review |
J&J/Auris: Largest Earnout Award in Delaware History
The September 2024 judgment found J&J:
- Initiated "Project Manhattan" pitting Auris technology against internal products
- Changed employee incentives away from earnout milestones
- Concealed that a clinical trial death would delay milestone achievement
- Violated explicit prohibition on considering milestone costs in development decisions
Judgment: $1.1 billion+ with interest—under appeal to Delaware Supreme Court.
Dispute Statistics
| Metric | 2023 | 2025 | Trend |
|---|---|---|---|
| Deals with disputes | 28% | 31% | ↑ |
| Disputes among milestone-achieving deals | 32% | 36% | ↑ |
| Q1 earnout filings vs. prior year | — | 4x increase | ↑↑ |
| Deals paying zero milestones | 43% | 45% | ↑ |
Source: SRS Acquiom
Deal Structure Evolution: The Shift to Risk-Averse Structures
Upfront as Percentage of Total Deal Value (2019-2025)
| Year | Upfront % | CVR Usage | All-Cash Mega-Deals |
|---|---|---|---|
| 2019 | 13% | Low | Rare |
| 2021 | 38% | 9 deals | Moderate |
| 2022 | 30-35% | 9 deals | Increasing |
| 2023 | 25-35% | 20 deals (38%) | Common |
| 2024 | 7-20% | 7 deals (22%) | Dominant |
| 2025 H1 | 15% | 27 deals | Very Common |
Source: Fierce Biotech, SRS Acquiom
Milestone Achievement Rate Decline
| Period | Event Achievement | Value Achievement |
|---|---|---|
| 2017 | 31% | ~25% |
| 2019 | 33% | ~30% |
| 2021 | 34% (peak) | 34% |
| 2023 | 22% | 16% |
| 2025 | 22% | 16% |
The 12-point decline from 2021 to 2023 reflects both economic pressures on development programs and more stringent milestone definitions.
Deal Size Analysis
| Deal Size | Upfront % | Achievement Rate | Dominant Structure |
|---|---|---|---|
| Sub-$500M | 50-60% | ~35%+ | Development milestones |
| $500M-$1B | 40-50% | ~25% | 2-4 year earnouts |
| $1B-$5B | 30-50% | ~20% | 4-6 milestone events |
| $5B+ mega-deals | 70-90% | ~15% | All-cash or CVR |
Smaller deals pay out more frequently because earlier-stage milestones have higher achievement rates and smaller targets face less portfolio deprioritization risk.
Royalty Monetization: The Alternative to Milestone Uncertainty
Companies increasingly sell milestone rights to royalty aggregators, revealing market-implied valuations for uncertain future payments.
Royalty Aggregator League Table
| Rank | Buyer | 2024-2025 Capital Deployed | Strategy | Implied Discount Rate |
|---|---|---|---|---|
| 1 | Royalty Pharma | $2.8B (2024) | Approved products | 5-8% |
| 2 | Blackstone Life Sciences | $10B+ AUM | Phase 3 funding | 15-25% |
| 3 | DRI Healthcare | $1B+ since IPO | Pre-approval deals | 10-15% |
| 4 | XOMA Royalty | 120+ assets | Whole company deals | 15-25% |
Notable Monetization Transactions
| Transaction | Investment | Exit | Return | Holding Period |
|---|---|---|---|---|
| DRI/TZIELD | $100M | $210M to Sanofi | 110% | ~7 weeks |
| Royalty Pharma/Revolution Medicines | $2.0B | Pending | TBD | Ongoing |
| PTC/Royalty Pharma (Evrysdi) | — | $1.65B total | — | Ongoing |
DRI Healthcare's TZIELD transaction—buying for $100 million and selling to Sanofi for $210 million within weeks—demonstrates value arbitrage when strategic buyers emerge.
Implied Discount Rates by Asset Stage
| Asset Stage | Implied Discount Rate | Risk Level |
|---|---|---|
| Approved, commercial | 5-8% | Low |
| Near-commercial (Phase 3) | 10-15% | Moderate |
| Development stage | 15-25%+ | High |
| Preclinical | 25-40%+ | Very High |
Valuation Framework: What Biobucks Are Actually Worth
Based on the comprehensive data above, here's a framework for discounting announced milestone values:
Risk-Adjusted Milestone Valuation
| Milestone Type | Announced Value | Risk-Adjusted Value | Discount Factor |
|---|---|---|---|
| Upfront cash | $100M | $100M | 1.0x |
| Phase 1 milestones | $100M | $32M | 0.32x |
| Phase 2 milestones | $100M | $20M | 0.20x |
| Phase 3 milestones | $100M | $15M | 0.15x |
| Regulatory milestones | $100M | $11M | 0.11x |
| Commercial ($1B+ sales) | $100M | $3M | 0.03x |
| CVR (historical average) | $100M | $13M | 0.13x |
Worked Example: Valuing a Typical Deal
Announced: "$5 billion partnership"
| Component | Announced | Risk-Adjusted |
|---|---|---|
| Upfront | $300M | $300M |
| Phase 1/2 milestones | $500M | $130M |
| Phase 3 milestones | $1.0B | $150M |
| Regulatory milestones | $1.0B | $110M |
| Commercial milestones | $2.2B | $66M |
| Total | $5.0B | $756M |
| Implied payout rate | 15% |
Conclusion: Three Truths About Biopharma Milestones
First, announced biobucks dramatically overstate actual value. With only 22% of milestones paying out and commercial milestones at 3%, a headline "$5 billion deal" with $4 billion in milestones should be valued closer to $1.5-2 billion in expected payments. The industry's $95 billion in announced milestone potential has yielded just $9 billion in actual payments.
Second, CVRs have largely failed target shareholders. The Celgene CVR's $6.4 billion expiration—missing its deadline by just 36 days—and Genzyme's $0.88/share settlement versus $14/share potential demonstrate these instruments' poor track record. Yet CVR usage is surging, representing 37% of 2025 deal values.
Third, litigation is reshaping deal structures. The J&J/Auris $1.1 billion judgment and Alexion/Syntimmune $310 million award establish that acquirers face real liability for deprioritizing acquired programs. Expect more buyer-protective "sole discretion" language and shorter earnout periods.
For dealmakers, the data suggests a clear hierarchy: upfront cash is worth face value, early development milestones are worth ~30% of face value, and commercial milestones are essentially optionality worth 3-5% of announced amounts. Investors and analysts should discount headline biobucks accordingly.
Disclaimer: I am not a lawyer or financial adviser. This article does not constitute investment advice, legal advice, or financial advice of any kind. All information presented here is derived from publicly available sources including SEC filings, press releases, and industry reports. Details of specific transactions may have changed since publication. Readers should conduct their own due diligence and consult with qualified legal and financial professionals before making any investment or business decisions.
Member discussion