Royalty Financing for Biosimilars: Structure, Economics, and Modelling Considerations

Biosimilar companies are capital-intensive, margin-constrained, and acutely exposed to competitive timing risk. They spend $100 million to $250 million developing a product that must launch into a market where pricing power erodes with every subsequent entrant. Their revenues are structurally declining from day one. And yet, a growing number of biosimilar-adjacent transactions are embedding royalty economics, whether through licensing royalties owed to originators under patent settlements, synthetic royalty monetisations against biosimilar revenue streams, or hybrid credit facilities secured by biosimilar cashflows.
The question for royalty finance specialists is whether these structures make sense, how they differ from royalties on innovative biologics, and what modelling adjustments they require.
WilmerHale's analysis of the broader royalty finance market estimates approximately $14 billion in annual deal flow, with the total value of royalty deals growing at a compound annual rate of 45%. Goodwin notes that nearly 90% of biotech executives are now considering a royalty financing in the next three years. Yet almost none of the high-profile transactions cited by these firms involve biosimilar assets as the primary collateral.
The short answer is that pure biosimilar royalty monetisations remain rare compared to innovative-asset deals. The structural reasons for this are straightforward: biosimilar revenue trajectories are fundamentally different from those of novel drugs.
But the market is not static. As biosimilar portfolios scale, as developers seek non-dilutive capital to fund multi-product pipelines, and as royalty investors look for yield in adjacent asset classes, the intersection of biosimilars and royalty finance is becoming a meaningful area of deal activity.
Where biosimilar royalties originate
Royalties in the biosimilar context arise from several distinct sources, each with different risk and return characteristics.
Settlement and licence royalties to the originator. The most common source of biosimilar royalty obligations is patent settlement agreements between the originator and the biosimilar applicant. Under the Biologics Price Competition and Innovation Act (BPCI Act) framework in the United States, biosimilar applicants frequently resolve patent disputes through settlements that grant a time-limited, royalty-bearing licence.
Coherus BioSciences, for example, settled with AbbVie in 2019 and received a non-exclusive licence to commercialise its adalimumab biosimilar Yusimry in the U.S. from December 2023, subject to royalty payments to AbbVie on undisclosed terms.
When Coherus later divested Udenyca to Intas Pharmaceuticals for up to $558 million, it earmarked approximately $49 million of the proceeds specifically to buy out certain royalty obligations tied to the drug. These settlement royalties are economic friction that sits between the biosimilar's gross margin and its free cashflow, and they can be substantial: typical settlement royalty rates for high-value biologics like adalimumab are reported in industry analyses to range from mid-single-digit to low-double-digit percentages of net sales.
Developer-to-commercialiser licensing royalties. Biosimilar development is increasingly separated from commercialisation. A developer such as Samsung Bioepis, Alvotech, or Polpharma Biologics creates the molecule and manufacturing process, then licences commercialisation rights to a partner with market access. Biogen's long-running arrangement with Samsung Bioepis generated royalty and other revenue on biosimilar products as disclosed in its SEC filings, where Biogen recognised royalty income from Samsung Bioepis under their licence arrangements.
When Biogen expanded the partnership in 2019 to include two ophthalmology biosimilars, it paid $100 million upfront plus up to $210 million in milestones and received a royalty on biosimilar sales in China, illustrating the scale and complexity of biosimilar licensing economics.
Alvotech's partnership with Teva for the U.S. commercialisation of SIMLANDI (adalimumab-ryvk) and other biosimilars is structured around milestone payments and profit-sharing, with Alvotech handling development and manufacturing while Teva manages commercialisation. Alvotech reported record revenues of $490 million in 2024, of which $216 million came from licence and milestone income, demonstrating the scale that biosimilar licensing royalties can achieve.
Coherus separately in-licensed an Avastin biosimilar from Innovent Biologics and agreed to pay up to $45 million in milestones plus customary double-digit royalty payments. These inter-company royalties are the cashflows most analogous to traditional pharmaceutical royalty streams, and they are the most natural candidates for monetisation.
Synthetic royalty and revenue interest financings secured by biosimilar sales. In 2024, Coherus entered into a combined term loan and product royalty financing agreement with Barings under which it received $37.5 million in return for a net sales royalty percentage on U.S. sales of LOQTORZI and UDENYCA (a biosimilar) up to a hard cap.
This is a direct example of a biosimilar revenue stream being used as collateral in a royalty monetisation. Earlier, Coherus had secured a $75 million senior secured credit facility with HealthCare Royalty Partners in 2019, structured as a debt facility but underwritten against the commercial performance of its biosimilar portfolio. HealthCare Royalty's willingness to lend against biosimilar revenues at the commercial launch stage demonstrates that royalty-oriented investors have been active in this space for years, albeit typically through debt-like structures rather than pure royalty sales.
Why biosimilar royalties differ from innovative-asset royalties
The economic properties of biosimilar cashflows create a fundamentally different underwriting proposition for royalty investors. Five characteristics stand out.
Compressed and declining revenue trajectories
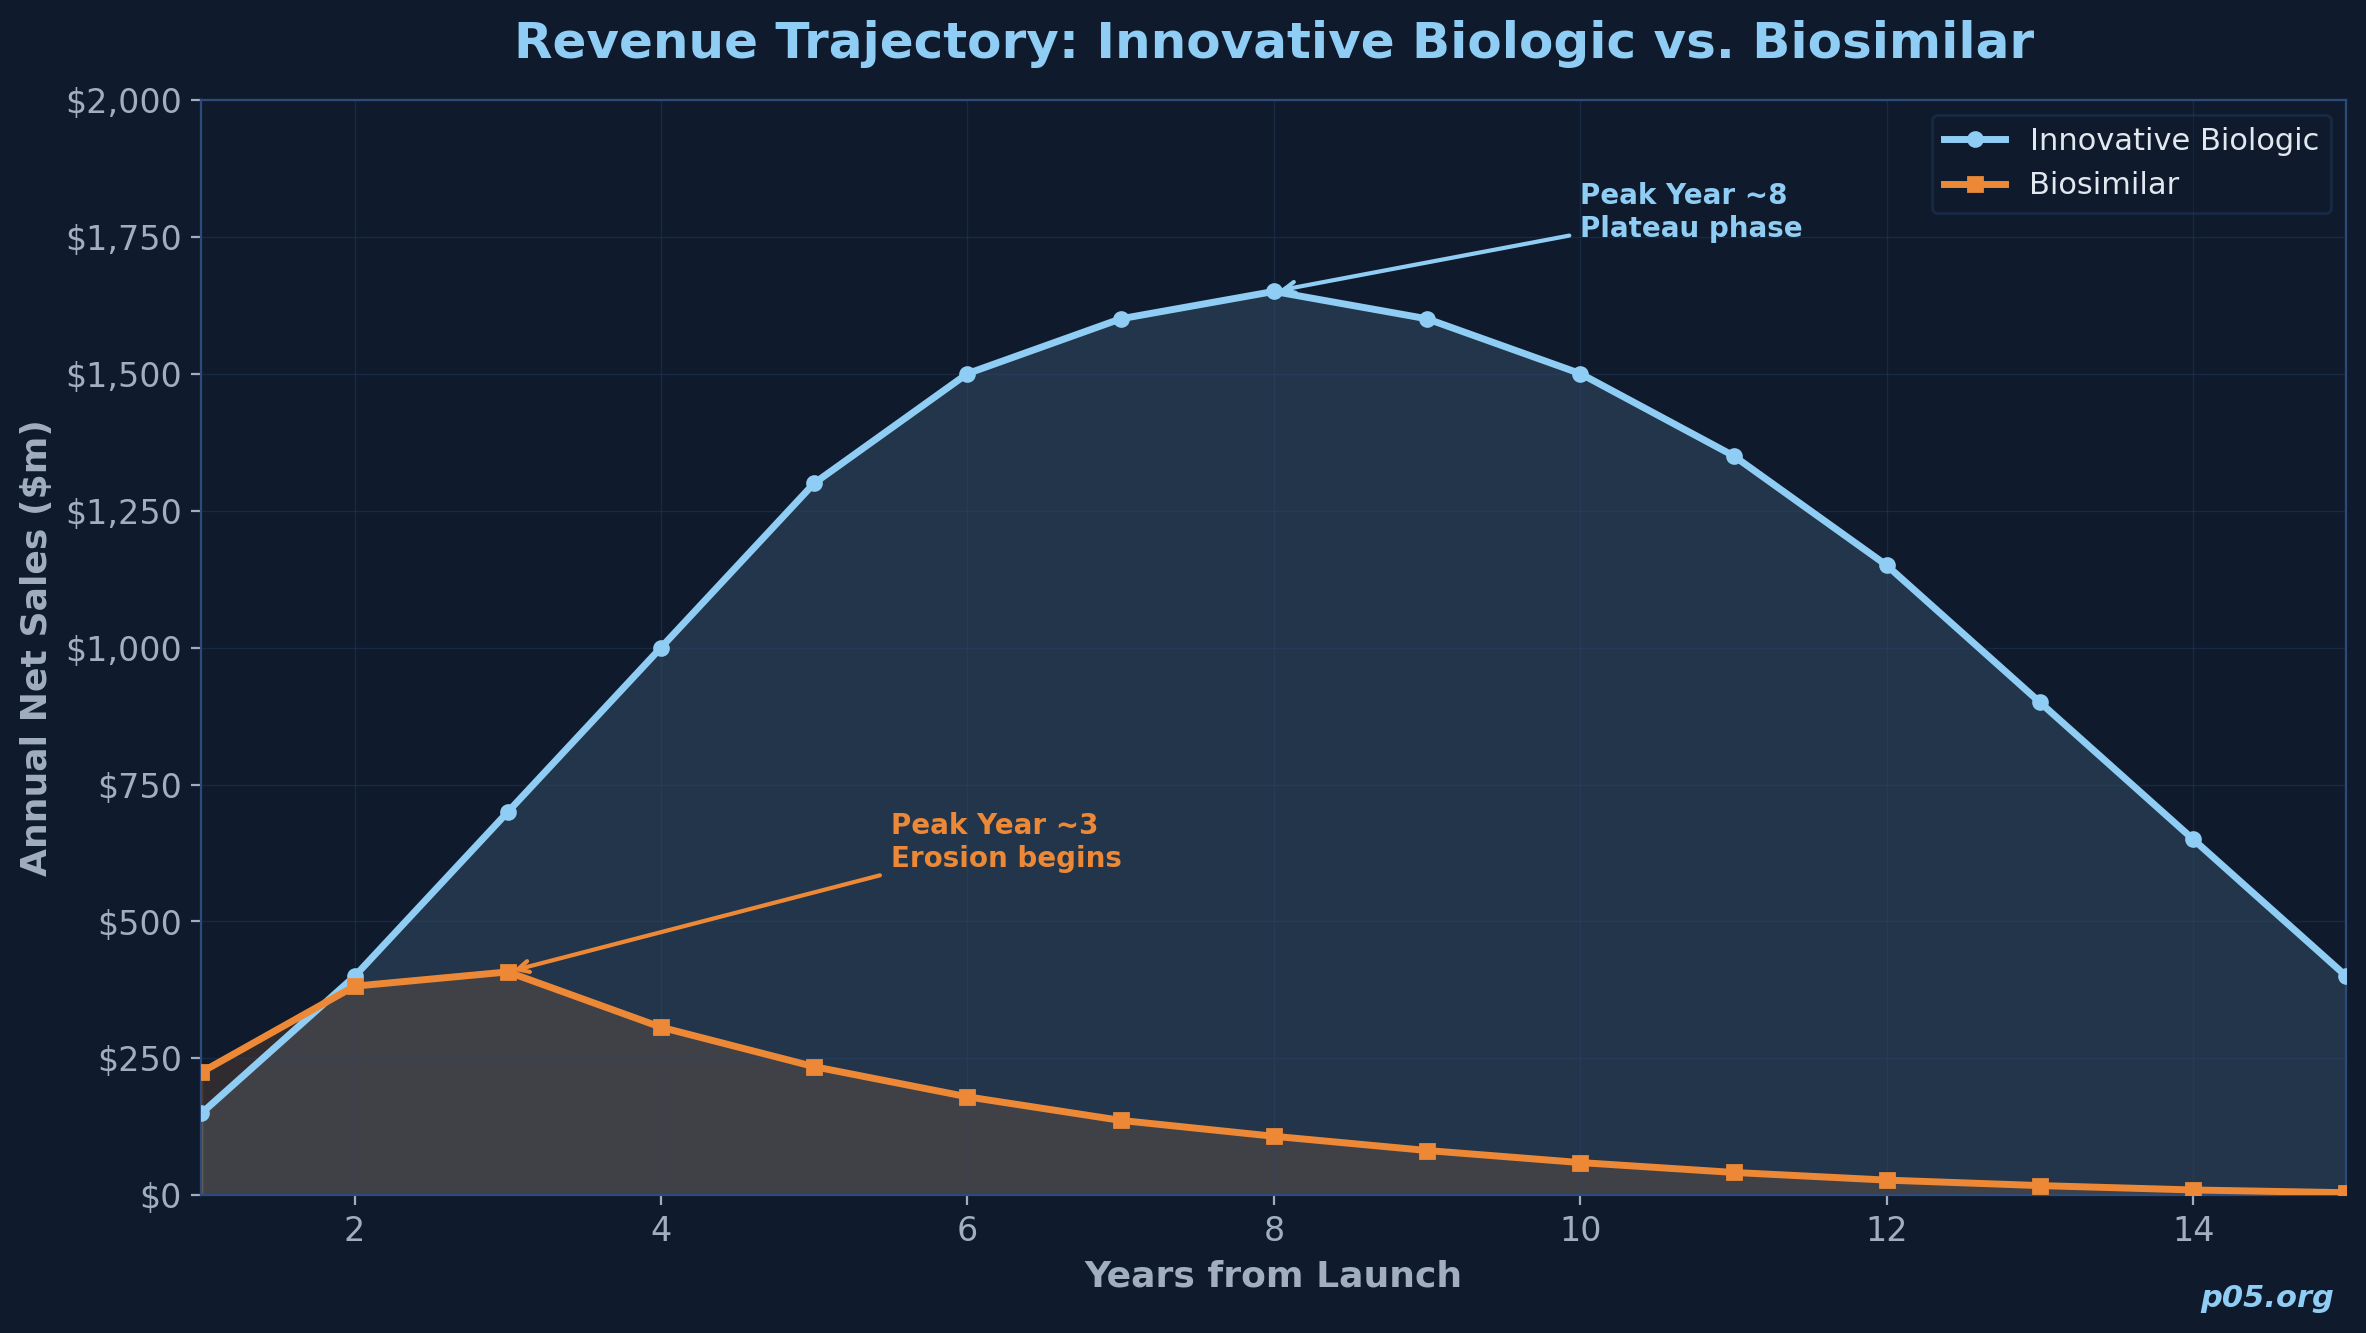
Innovative biologics typically follow a launch, ramp, plateau, and decline curve that can span 15 to 20 years. Biosimilars face a radically different trajectory. BCG analysis of U.S. biosimilar markets shows that biosimilar products have typically seen a 10% to 20% discount to the reference brand price immediately after market formation, followed by 10% to 20% annual price erosion thereafter. In Europe, initial discounts of 30% to 50% are common, with continued annual erosion.
The Association for Accessible Medicines reported that as of July 2025, nine biosimilar products were on the market for Stelara alone, with prices as much as 90% below the original list price. This compressive pricing dynamic means that the investor's royalty base is shrinking over time, even if unit volumes grow. A royalty on a biosimilar's net sales is a royalty on a price-eroding asset.
Multi-entrant competitive dynamics
For innovative biologics, the royalty investor typically underwrites a product with patent-protected exclusivity for most of the relevant projection period. For biosimilars, the number of competitors entering a given molecule's market is a primary driver of both price and market share. Research published in the Journal of Managed Care & Specialty Pharmacy found that each additional biosimilar competitor resulted in a 10% to 13% decrease in the originator's price ratio, and that the first two to three entrants in a molecule typically capture more than 90% of the biosimilar market share.
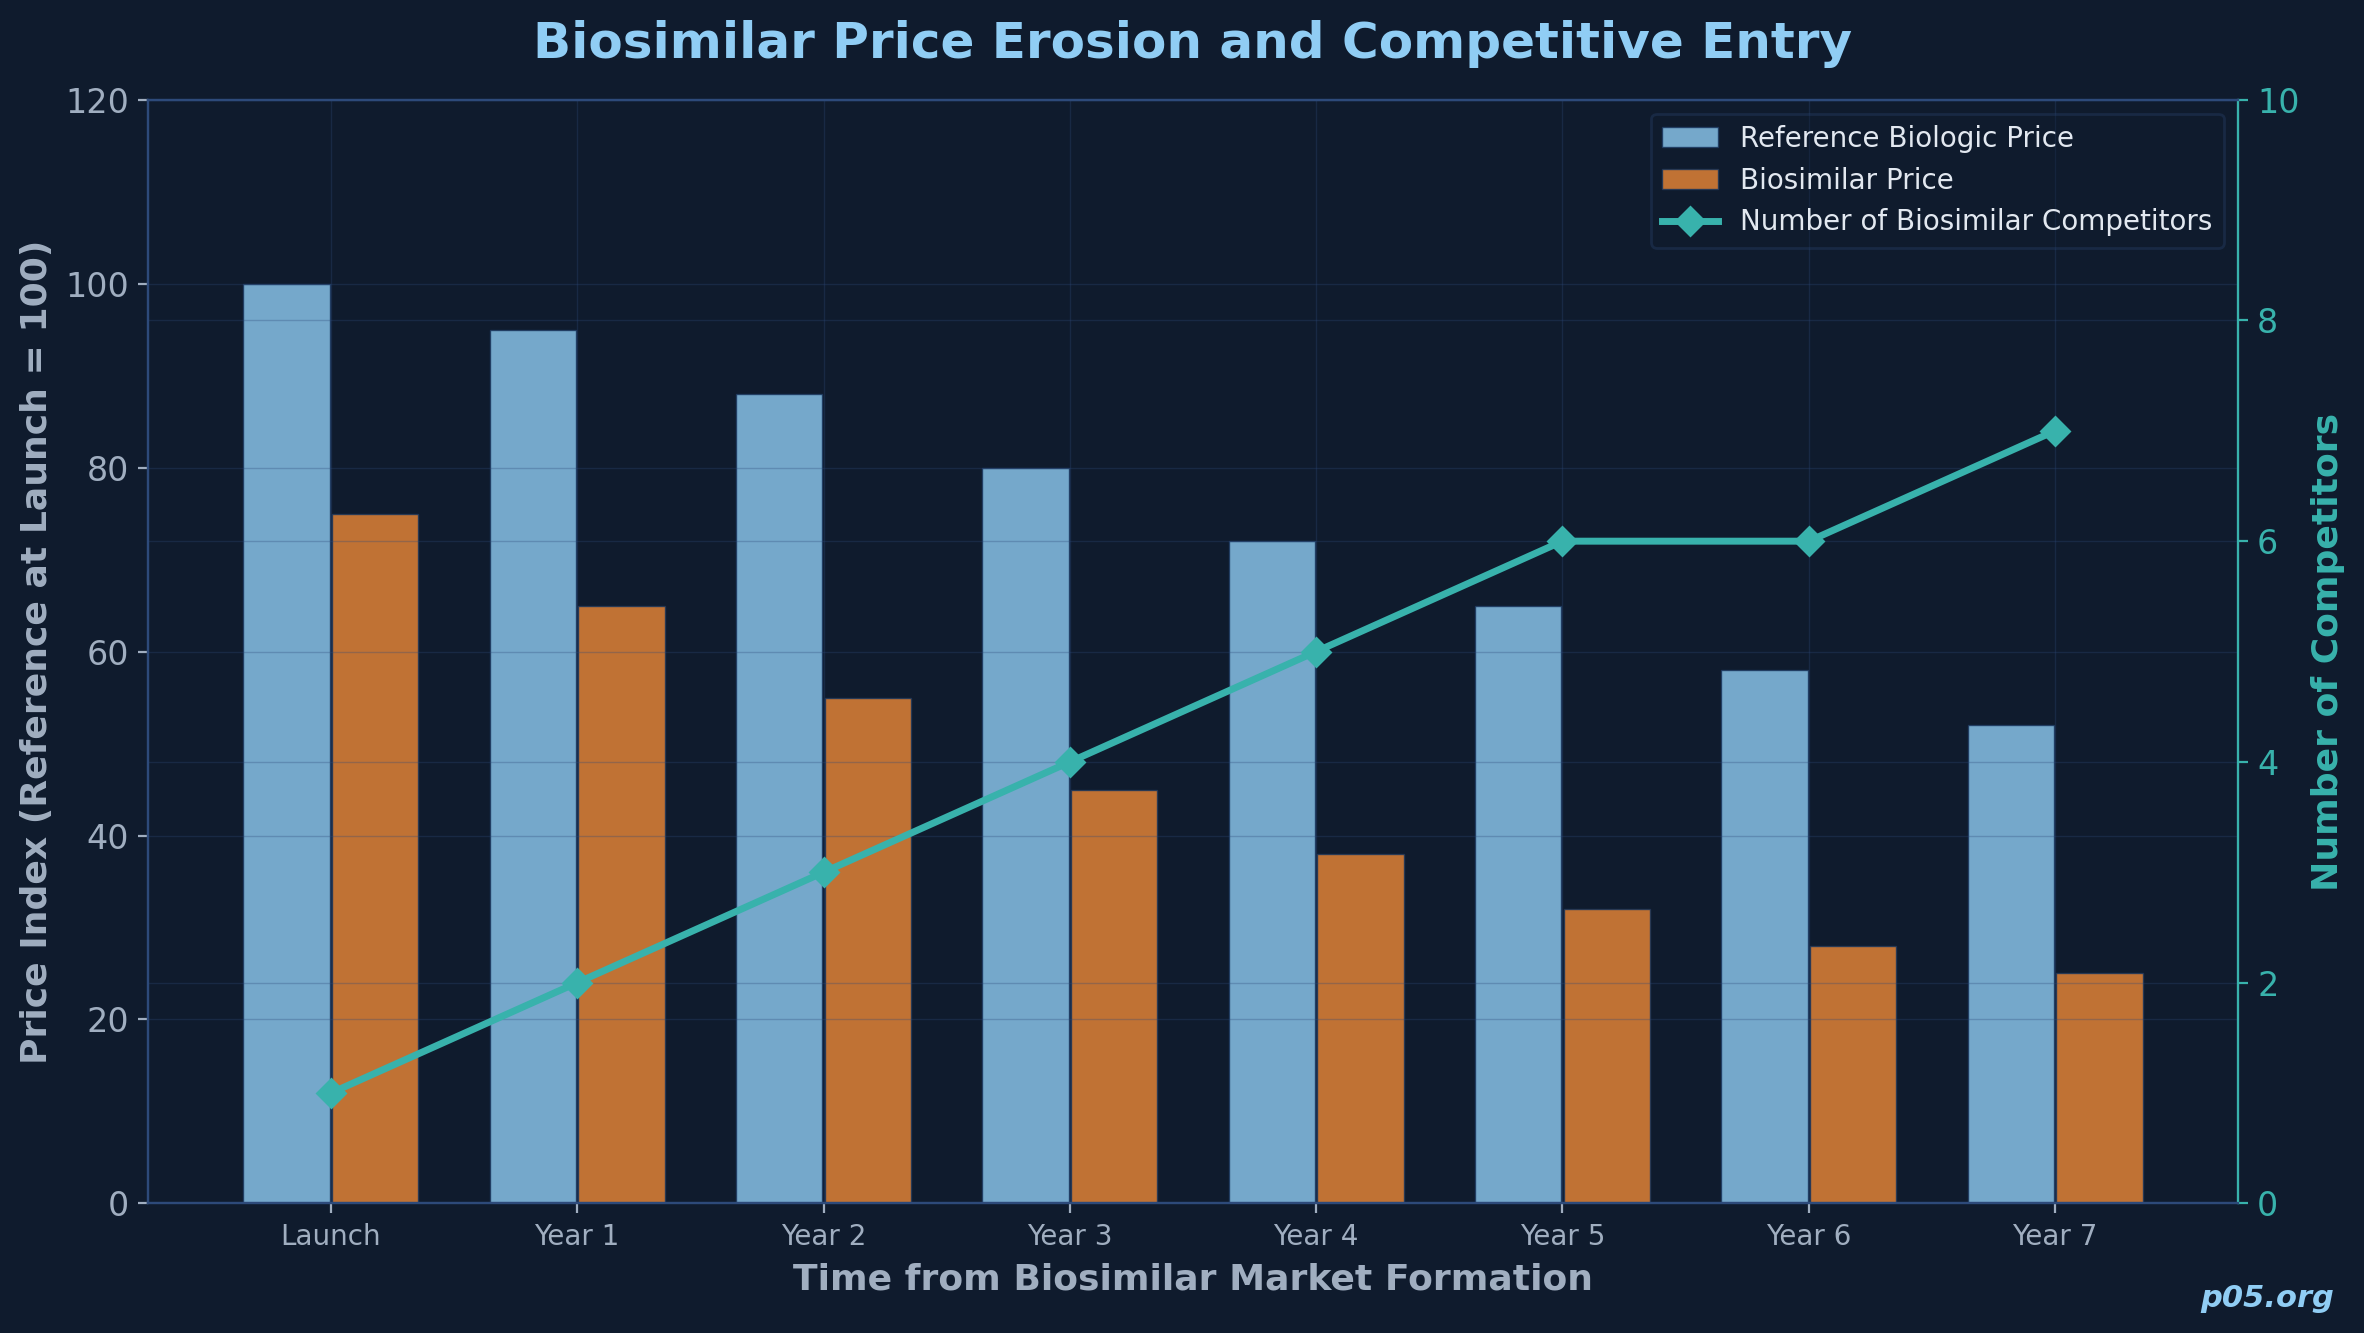
An analysis by DrugPatentWatch found that over a five-year period following first biosimilar entry, reimbursement rates for reference biologics fell by an average of 32.7%, while biosimilar rates themselves fell by 50.3%. For the royalty investor, this means that an early-mover advantage is critical but fragile: the company paying the royalty may be first to market, but its share and pricing will erode as competitors arrive. Modelling must account for a multi-entrant scenario where both the revenue base and the company's share of that base are declining simultaneously.
Margin structure and cost of goods
Biosimilar gross margins are structurally lower than those of innovative biologics. Development costs of $100 million to $250 million are amortised over a shorter commercial life, and cost of goods for complex biologics remains high relative to small-molecule generics. This has direct implications for the sustainability of royalty payments.
A biosimilar company paying a 10% royalty to an originator under a patent settlement and a further 5% synthetic royalty to a financing investor is surrendering 15% of net sales off the top, before manufacturing costs, commercial expenses, and general overhead. At the biosimilar margin structure, the economic headroom for royalty obligations is narrower than for innovative products.
Shorter effective duration
Biosimilar revenues tend to have a shorter effective life than innovative biologic revenues. As additional biosimilar competitors enter and price erosion accelerates, the revenue base available for royalty payments shrinks.
A five-year projection for a biosimilar may cover the majority of its economic value, whereas innovative biologics routinely generate meaningful revenues for a decade or more post-launch. This compression affects the investor's ability to reach a target return multiple and places a premium on front-loaded cashflow capture.
Regulatory and IP timing uncertainty
The timing of biosimilar market entry is heavily influenced by patent litigation and settlement outcomes, FDA review timelines, and interchangeability determinations. AbbVie's use of a patent thicket around Humira, involving over 130 issued patents according to Congressional Research Service analysis, delayed biosimilar entry in the U.S. for years beyond the original biologic's initial patent expiry.
For royalty investors, this creates a binary risk around whether, and when, the biosimilar generating the royalty will actually launch. Pre-launch biosimilar royalty financing therefore carries regulatory timing risk that is analogous to, but different from, the clinical development risk present in pre-approval innovative-asset deals.
Deal structures in practice
While dedicated biosimilar royalty monetisation vehicles are not yet common, several transaction archetypes illustrate how royalty economics interact with biosimilar cashflows.
Revenue interest financings with biosimilar collateral
The Coherus/Barings transaction described above is an example of a hybrid structure where the investor receives a net sales royalty percentage on a basket that includes a biosimilar product, up to a hard cap. This is structurally similar to the capped synthetic royalties seen in innovative-asset deals (such as Geron's Royalty Pharma agreement or BioCryst's OMERS arrangement), but the underlying economics differ because the biosimilar's revenue trajectory is subject to multi-entrant price erosion.
The hard cap is particularly important in biosimilar-linked structures because the declining revenue base may not support uncapped receipts over a long time horizon.
Royalty-secured debt facilities
HealthCare Royalty Partners' $75 million credit facility with Coherus in 2019 was structured as senior secured debt, but underwritten against the commercial performance of Coherus' biosimilar franchise. This hybrid structure, common in the broader royalty finance market, allows the investor to benefit from biosimilar revenue upside while maintaining the protective features of a debt instrument (security interest, covenants, maturity).
For biosimilar companies, the advantage is access to capital at rates that reflect the underlying asset's commercial risk rather than the company's overall credit profile. For the investor, the debt structure provides priority claims and covenant protections that may be more important when the underlying asset faces multi-entrant competitive risk.
Licensing royalty monetisation
Where a biosimilar developer receives royalties from a commercialisation partner, those royalties can be monetised in the same way as any traditional pharmaceutical royalty. Biogen's disclosed royalty revenue from Samsung Bioepis on its biosimilar portfolio is exactly the type of cashflow that could be sold or financed through a royalty purchase agreement.
The economics depend on the durability of the underlying licensing arrangement and the commercial trajectory of the products. In biosimilar licensing, the developer's royalty rate may itself be subject to adjustment based on sales performance, creating a layered risk for any secondary royalty purchaser.
Originator settlement royalty buyouts
When a biosimilar company divests a product or portfolio, outstanding royalty obligations to the originator must be addressed. Coherus earmarked $49 million from its Udenyca sale to buy out originator royalty obligations. This is economically equivalent to a lump-sum present-value settlement of a future royalty stream. For specialised royalty investors, these buyout transactions create opportunities to acquire originator royalty claims at a discount, effectively taking a position on the biosimilar's remaining revenue trajectory.
The premium question: biosimilar royalties versus debt
The cost of biosimilar royalty financing relative to traditional debt is shaped by several factors that typically push implied yields higher than for innovative-asset royalties.
The shorter effective duration of biosimilar revenues means that the investor needs to achieve its target return multiple faster. In a standard innovative-asset royalty with a 10-to-15-year projection horizon, a 1.7x cap at a 5% royalty rate may be achievable within 10 to 12 years, generating an investor IRR in the 8% to 12% range.
For a biosimilar with a five-to-eight-year effective life, achieving the same multiple requires a higher royalty rate, a lower purchase price relative to expected cashflows, or both. The implied cost of capital to the biosimilar company is therefore higher.
Multi-entrant risk amplifies the pricing premium. Innovative biologics typically face biosimilar competition only after patent expiry, and even then, the revenue decline is gradual. A biosimilar, by contrast, may face three to five direct competitors within its first two to three years on the market. This competitive intensity creates wider dispersion in potential outcomes and pushes the investor's required return upward.
In practice, the limited publicly available data on biosimilar-specific royalty financing terms suggests implied yields in the mid-teens, compared to high-single-digit to low-double-digit yields typical of commercial-stage innovative-asset royalties. However, these estimates should be treated with caution, as few biosimilar royalty transactions are disclosed with sufficient detail to calculate precise implied returns.
Compared to venture debt at 12% to 15% coupon rates with warrant coverage, or convertible notes with equity dilution, a biosimilar royalty financing may be competitive on total cost of capital, particularly for companies with near-commercial or commercial-stage products where the revenue stream provides a concrete basis for underwriting.
Modelling biosimilar royalty cashflows
Modelling a biosimilar royalty financing requires adjustments to the standard royalty valuation framework across several dimensions.
Revenue projection: the erosion curve
The central modelling challenge is the revenue trajectory. For innovative biologics, the standard approach is to project peak sales, estimate years to peak, and model a post-peak decline driven by patent expiry and loss of exclusivity. For biosimilars, the relevant model is an S-curve of market penetration against a declining price base.
The key inputs are: the reference biologic's current sales (the addressable market), the biosimilar's expected launch discount (typically 15% to 40% in the U.S., 30% to 50% in Europe), the expected number and timing of competing biosimilars, the annual price erosion rate (typically 10% to 20% per year in the U.S. after the initial discount), and the biosimilar company's expected market share trajectory.
A simplified illustrative projection for a biosimilar entering a $5 billion reference market might look as follows:
| Year | Reference market ($m) | Biosimilar class share | Company share of biosimilar | Net price (% of ref.) | Company net sales ($m) |
|---|---|---|---|---|---|
| 1 | 5,000 | 15% | 40% | 75% | 225 |
| 2 | 4,800 | 35% | 35% | 65% | 382 |
| 3 | 4,500 | 55% | 30% | 55% | 408 |
| 4 | 4,200 | 65% | 25% | 45% | 307 |
| 5 | 3,900 | 72% | 22% | 38% | 235 |
| 6 | 3,600 | 78% | 20% | 32% | 180 |
| 7 | 3,300 | 82% | 18% | 28% | 137 |
| 8 | 3,000 | 85% | 17% | 25% | 108 |
Several features of this projection are notable. The reference market itself is declining as total biologic spending shifts. The biosimilar class share is growing, but the company's share within the biosimilar class is declining as more entrants arrive. And the net price is falling each year. The company's net sales peak in Year 3 and then decline, creating a revenue trajectory that is fundamentally different from the launch-ramp-plateau pattern of an innovative biologic.
Royalty cashflow projection with cap
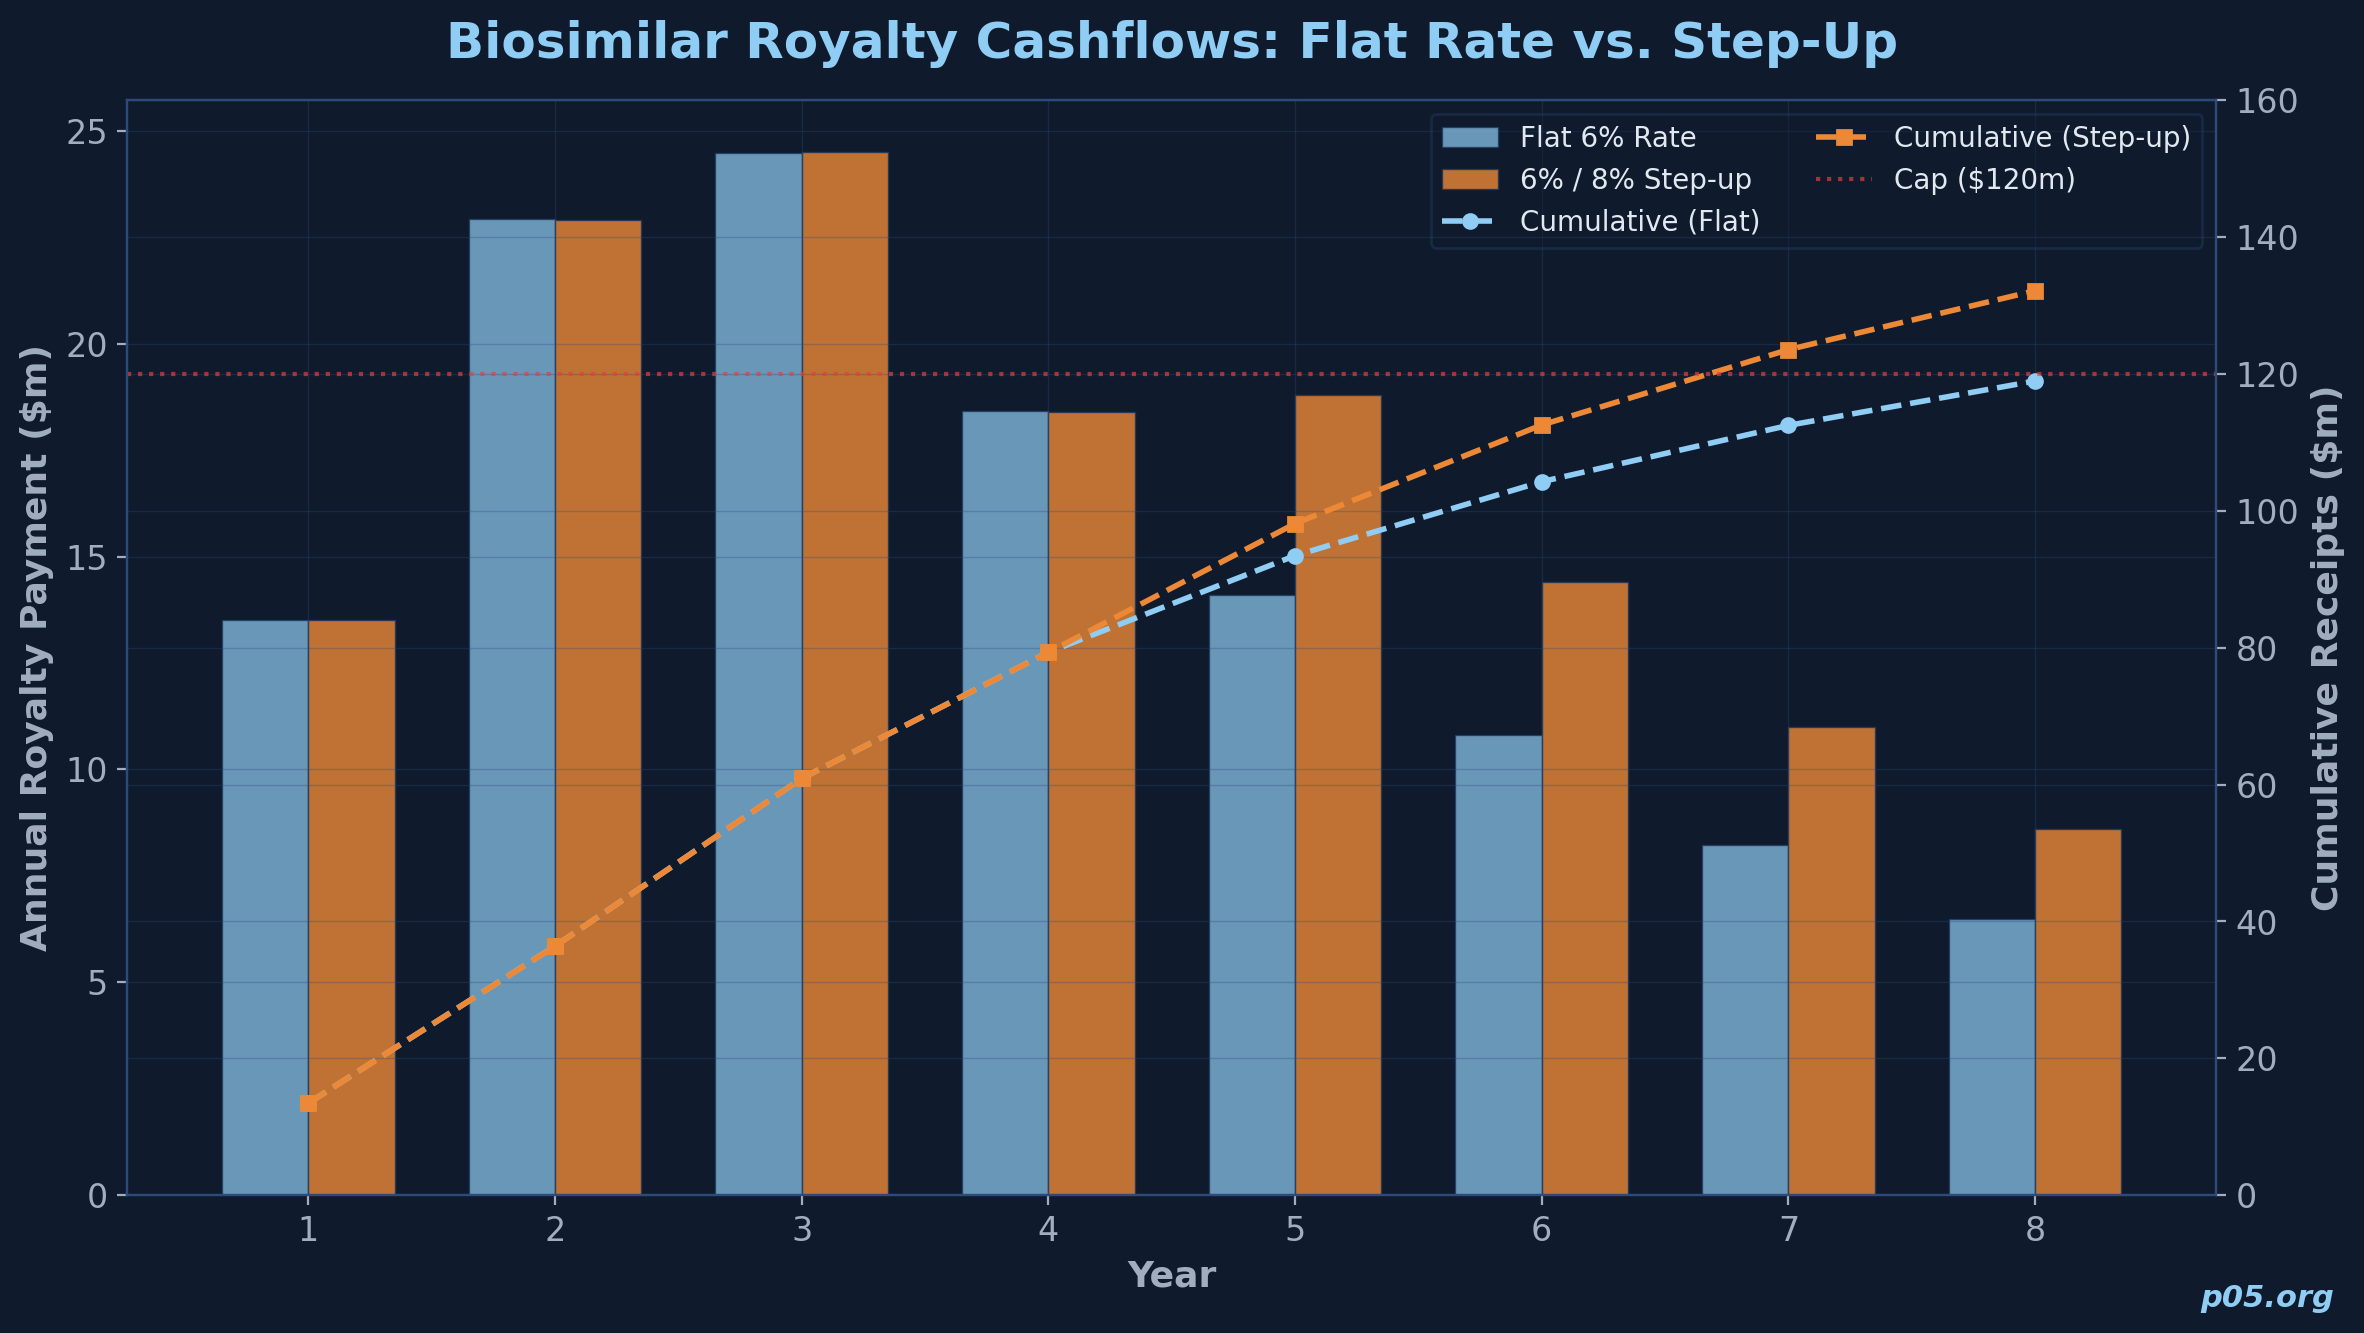
Applying a 6% royalty rate and a cap of $120 million (representing a 1.5x multiple on an $80 million purchase price):
| Year | Company net sales ($m) | Royalty rate | Royalty payment ($m) | Cumulative ($m) |
|---|---|---|---|---|
| 1 | 225 | 6.0% | 13.5 | 13.5 |
| 2 | 382 | 6.0% | 22.9 | 36.4 |
| 3 | 408 | 6.0% | 24.5 | 60.9 |
| 4 | 307 | 6.0% | 18.4 | 79.3 |
| 5 | 235 | 6.0% | 14.1 | 93.4 |
| 6 | 180 | 6.0% | 10.8 | 104.2 |
| 7 | 137 | 6.0% | 8.2 | 112.4 |
| 8 | 108 | 6.0% | 6.5 | 118.9 |
Under these assumptions, the investor does not reach the $120 million cap within 8 years. The IRR on $80 million invested, receiving the cashflows above, is approximately 11.2% through Year 8 without reaching the cap. If a step-up provision increased the rate to 8% when prior-year sales fell below $300 million (triggering in Years 5 through 8), the total cumulative receipts rise to approximately $126 million and the cap is reached in Year 8, improving the IRR to approximately 12.8%.
Sensitivity analysis
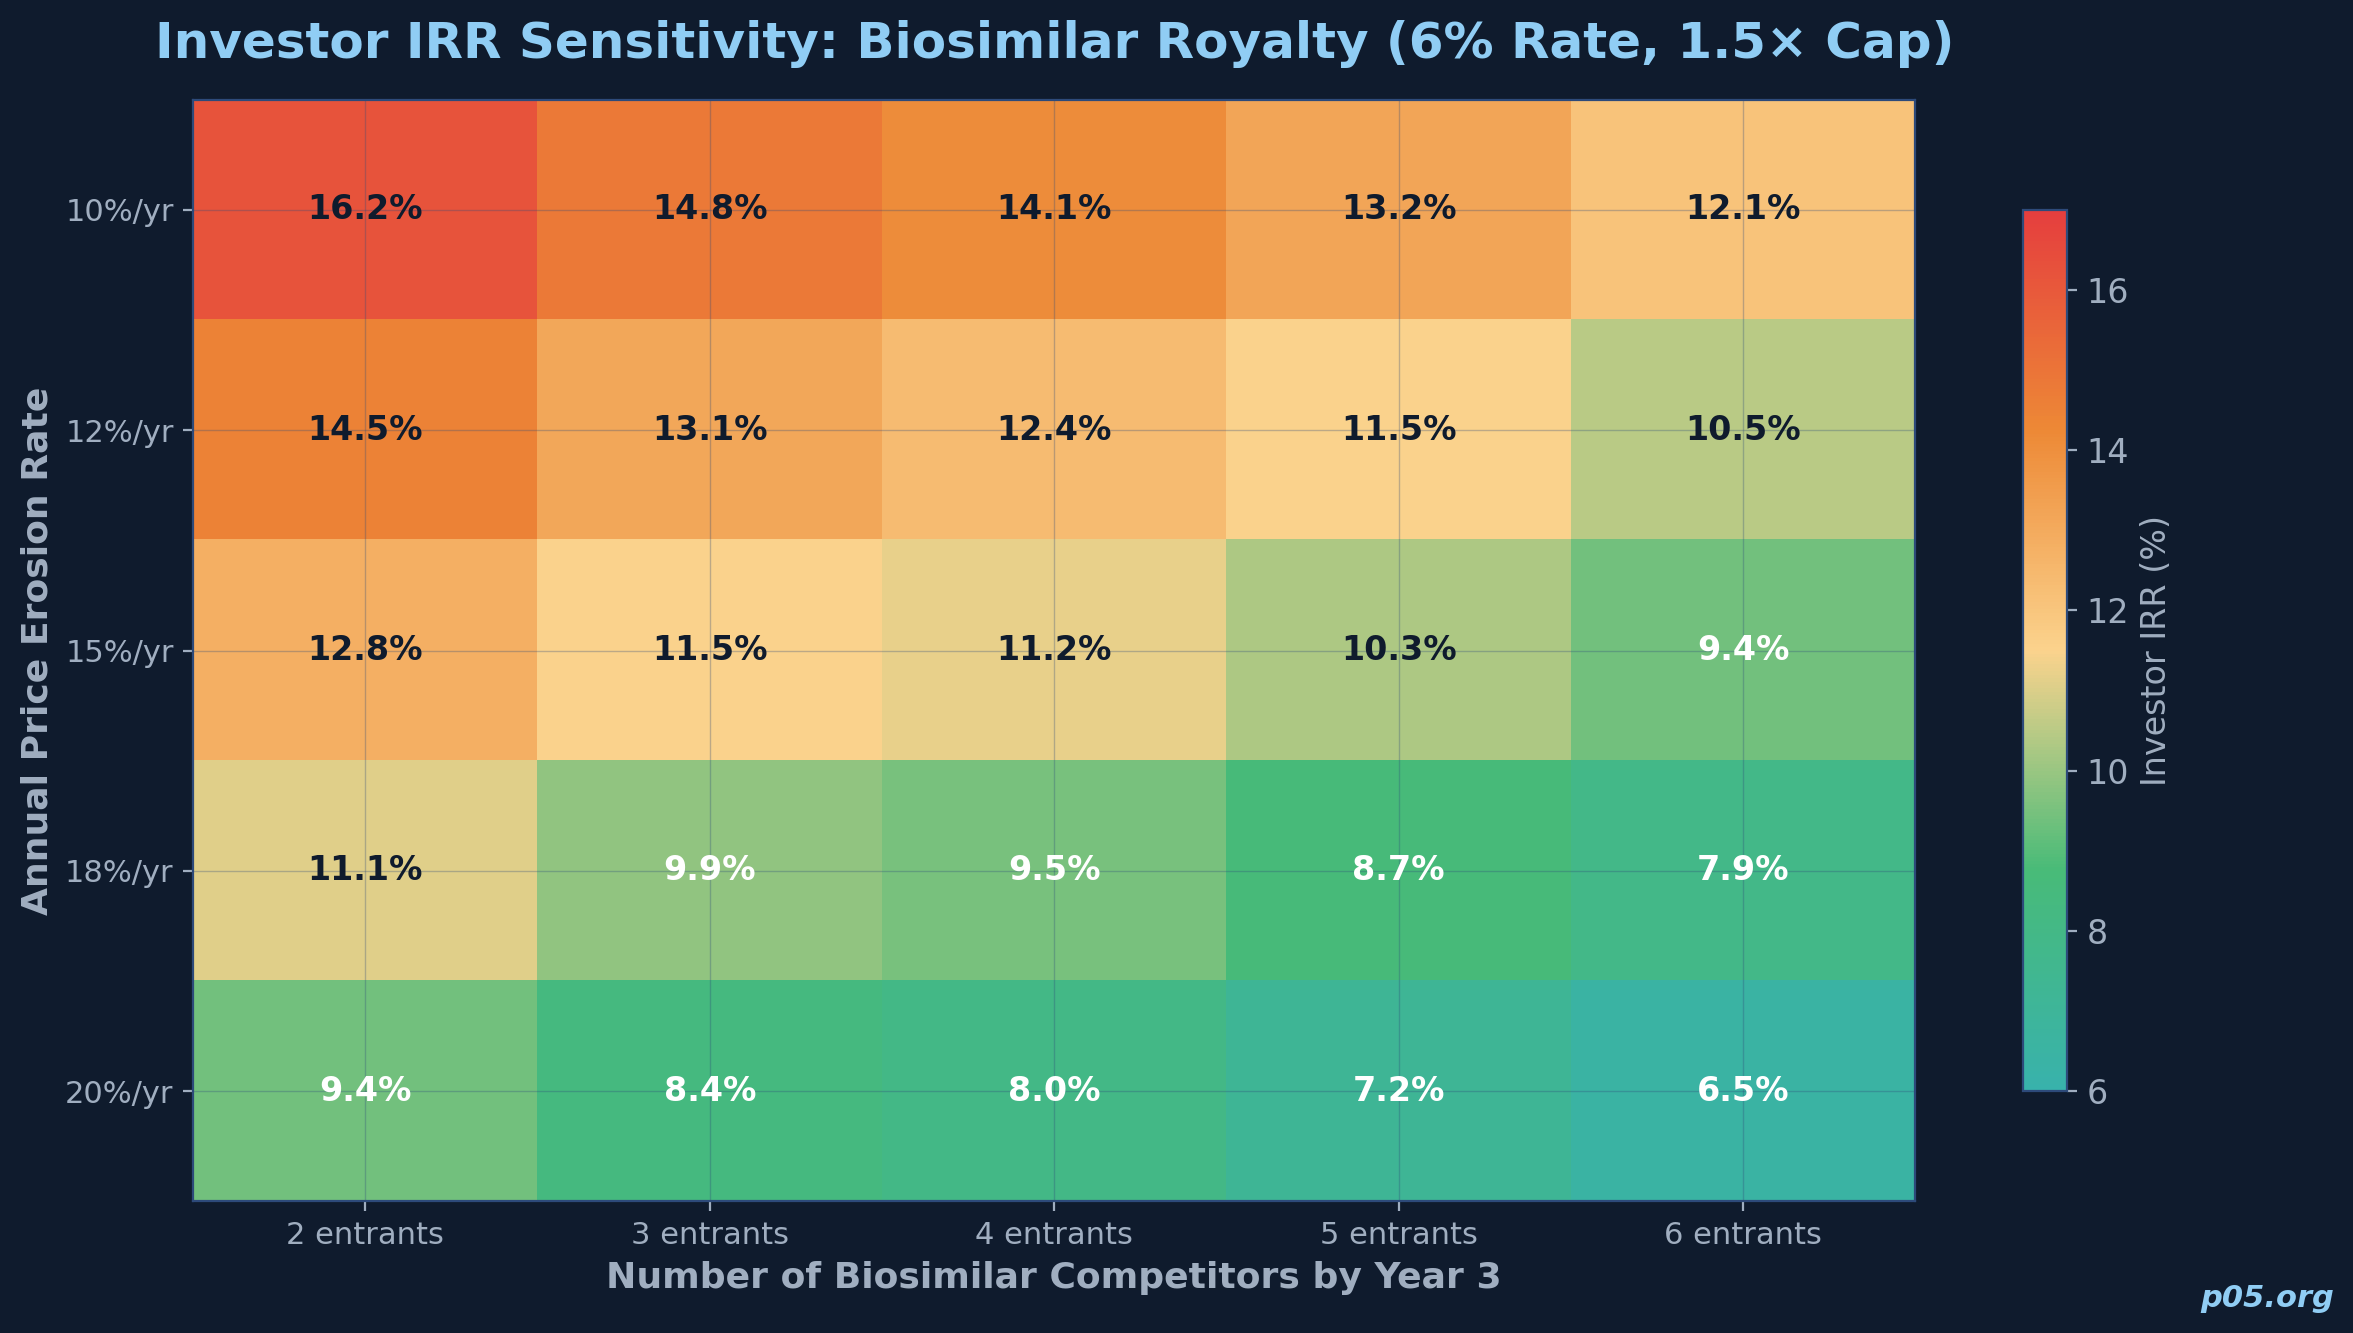
| Scenario | Price erosion rate | Number of competitors by Year 3 | Royalty rate | IRR (8-year) | Cap reached? |
|---|---|---|---|---|---|
| Base | 15%/yr | 4 | 6.0% | 11.2% | No |
| Aggressive competition | 20%/yr | 6 | 6.0% | 8.4% | No |
| Favourable | 10%/yr | 3 | 6.0% | 14.1% | Yes (Year 7) |
| Base + step-up | 15%/yr | 4 | 6.0% / 8.0% | 12.8% | Yes (Year 8) |
| High rate | 15%/yr | 4 | 8.0% | 14.5% | Yes (Year 6) |
The key takeaway is that biosimilar royalty returns are highly sensitive to the rate of price erosion and the number of competitors. A two-percentage-point increase in annual price erosion can reduce the investor's IRR by nearly 300 basis points. This sensitivity is substantially greater than in innovative-asset royalty models, where the revenue base is more stable during the projection period.
Adjustments for biosimilar-specific risks
Several modelling adjustments are specific to biosimilar royalties.
Launch timing risk. If the biosimilar's market entry is delayed by patent litigation, FDA review, or manufacturing issues, the first-mover advantage window narrows. Models should include a scenario where launch is delayed by 6 to 12 months, which can materially reduce the company's peak market share and shorten the period of favourable pricing.
Interchangeability designation. In the U.S., biosimilars designated as interchangeable can be substituted at the pharmacy level without prescriber intervention. This designation can materially increase market uptake. Models should include an upside scenario if interchangeability is granted and a base scenario without it.
Settlement royalty stacking. If the biosimilar company owes royalties to the originator under a patent settlement, those payments reduce the net cashflow available for a synthetic royalty financing. The model should project net cashflow after settlement royalties and assess whether the remaining margin supports additional royalty obligations.
Reference product lifecycle. If the originator launches a next-generation biologic (a new formulation, delivery device, or indication), the addressable market for the biosimilar may shrink faster than the multi-entrant erosion curve alone would suggest. AbbVie's launch of Skyrizi and Rinvoq to replace Humira revenue is a case study in how originator lifecycle management can undermine biosimilar market potential.
Why a biosimilar company would choose royalty financing
Despite the structural challenges, royalty financing offers biosimilar companies several distinct advantages over alternative capital sources.
Non-dilutive capital is particularly valuable for biosimilar companies with thin margins and limited pricing power. ZS analysis shows that the total value of royalty deals has grown at a compound annual growth rate of 45%, compared to 25% for equity deals, and that royalty financing has proven more resilient against macroeconomic volatility than equity markets. An equity raise at depressed valuations, common for biosimilar companies facing competitive pressure, dilutes shareholders against a revenue base that is already declining.
A royalty financing instead monetises a specific revenue stream without diluting the company's equity, preserving optionality on the remaining portfolio.
No fixed debt service. Royalty payments are tied to net sales, which means they adjust naturally with the company's performance. In a scenario where biosimilar pricing erodes faster than expected, royalty payments decline proportionally. This is a material advantage over fixed-rate debt, where coupon payments are owed regardless of commercial performance. For a biosimilar company operating in a market where pricing can move 20% or more in a single year due to competitive dynamics, this flexibility is meaningful.
Launch capital timing. Biosimilar companies often need capital at the moment of commercial launch, when spending on sales force build-out, inventory, and market access is highest but revenues have not yet ramped. Royalty financing can be sized and timed to match this need, with payments beginning only when the product generates sales. This aligns the capital source with the capital requirement more naturally than debt facilities with fixed amortisation schedules.
Portfolio-level financing. As biosimilar companies build multi-product portfolios, they can potentially finance against a basket of products rather than a single asset.
This diversification reduces the investor's exposure to any single molecule's competitive dynamics and may allow for more favourable terms. The Coherus/Barings transaction, which referenced both LOQTORZI and UDENYCA, is an early example of this basket approach.
Structural considerations for investors
Investors evaluating biosimilar royalty opportunities should consider several structural features that are more important in this context than in traditional innovative-asset royalties.
Cap multiples and effective duration. Given the compressed revenue trajectory, caps should be calibrated to be achievable within five to eight years. Higher cap multiples (above 2.0x) may not be reachable within the biosimilar's economic life, creating a situation where the investor holds an asset that never reaches its contractual maximum. Geron-style time-based cap step-ups, where the cap multiple increases if not achieved by a certain date, may be less useful in biosimilar contexts because the revenue base may be too small in later years to reach even an increased cap.
Step-up provisions. Underperformance step-ups are structurally well-suited to biosimilar royalties, but the trigger thresholds need to be calibrated to the erosion curve rather than to the launch ramp. In an innovative-asset context, a step-up triggered by sales falling below a threshold compensates the investor for a slower-than-expected launch. In a biosimilar context, the analogous risk is faster-than-expected price erosion or earlier-than-expected competitor entry. Thresholds should reflect expected competitive dynamics, not just absolute sales levels.
Change-of-control provisions. Biosimilar companies are frequently acquisition targets, as demonstrated by Coherus' serial divestitures of its biosimilar assets. Change-of-control provisions should address both the assignment of the royalty obligation to the acquirer and the risk that the acquirer may prioritise its own biosimilar pipeline over the acquired product, potentially reducing commercial effort.
Intercreditor considerations. Many biosimilar companies have existing debt facilities with broad asset pledges. A royalty financing must be structured to coexist with these obligations, typically through a carve-out or a subordination arrangement. The Coherus capital structure, which involved a Pharmakon Advisors term loan of up to $300 million being repaid and replaced with the Barings combined term loan and royalty monetisation, illustrates the complexity of layering royalty economics onto an existing debt stack.
Outlook and emerging themes
Several trends suggest that the intersection of biosimilar and royalty finance will deepen. Gibson Dunn's 2026 outlook for the royalty finance market highlights both the growing deal volume and structural innovation across the sector, with biosimilar-linked transactions emerging as an area of interest alongside more traditional innovative-asset deals.
The biosimilar market is scaling rapidly. Sandoz reported biosimilar net sales of $2.9 billion in 2024, up 30% year-on-year. The FDA has approved 84 biosimilars for 21 reference products as of mid-2025, with $222 billion in biologic patent expiries expected over the coming decade. As the market grows, the absolute size of individual biosimilar revenue streams increases, making them more attractive as collateral for royalty-oriented transactions.
The separation of development and commercialisation is increasing the supply of licensable royalty streams. Companies like Alvotech, Polpharma Biologics, and Samsung Bioepis develop biosimilars and licence them to regional commercial partners. Each licence generates a royalty stream that could, in principle, be monetised. As these portfolios grow and establish commercial track records, the data available for underwriting improves.
Portfolio approaches may mitigate molecule-specific risk. A royalty investor that takes a position across a basket of biosimilar products, potentially spanning different molecules, therapeutic areas, and geographies, can diversify away some of the molecule-specific competitive risk that makes single-product biosimilar royalties challenging. This portfolio approach is more natural for larger royalty platforms with the capacity to underwrite multiple positions.
The "biosimilar void" identified by industry groups, where 90% of biologics losing patent protection over the next decade have no biosimilars in development, may create opportunities for development-stage royalty financing. If royalty investors can underwrite biosimilar development risk, particularly for molecules where the commercial opportunity is large but the development cost is a barrier, they may play a role analogous to the development funding transactions that have become common in the innovative-asset royalty market.
Worked example summary table
| Parameter | Innovative biologic (typical) | Biosimilar (illustrative) |
|---|---|---|
| Revenue trajectory | Launch → peak → plateau → decline over 12–15 years | Launch → peak (Year 2–3) → decline over 5–8 years |
| Annual price erosion post-peak | 5–10% (LOE-driven) | 10–20% (competitive entry-driven) |
| Number of direct competitors during projection | 0–2 (during patent life) | 3–6 (within first 3 years) |
| Typical royalty rate range | 3–10% of net sales | 5–10% of net sales |
| Cap multiple | 1.5–2.5x | 1.3–1.8x |
| Target IRR range | 8–14% | 11–17% |
| Effective duration to cap | 8–14 years | 5–8 years |
| Key underwriting risk | Clinical/regulatory, launch ramp | Competitive entry timing, price erosion rate |
All information in this article is derived from publicly available sources including SEC filings, press releases, regulatory announcements, and industry reports. Information may have changed since publication. This content is for informational purposes only and does not constitute investment, legal, or financial advice. The author is not a lawyer or financial adviser.
Member discussion