Transfer Pricing and Intercompany Royalties in Pharma: How BEPS Is Rewriting the Rules of Royalty Financing

When the IRS informed Amgen in 2021 that it owed $10.7 billion in back taxes and penalties—the largest transfer pricing dispute in pharmaceutical history—the agency was not merely quibbling over accounting methodology. It was challenging the fundamental architecture through which one of the world's largest biopharmaceutical companies allocated profits between its U.S. parent and its Puerto Rican manufacturing subsidiary, Amgen Manufacturing Limited (AML). The mechanism at issue was intercompany royalty pricing: the rate at which AML paid Amgen Inc. for the right to manufacture biologic drugs using Amgen's patented technology.
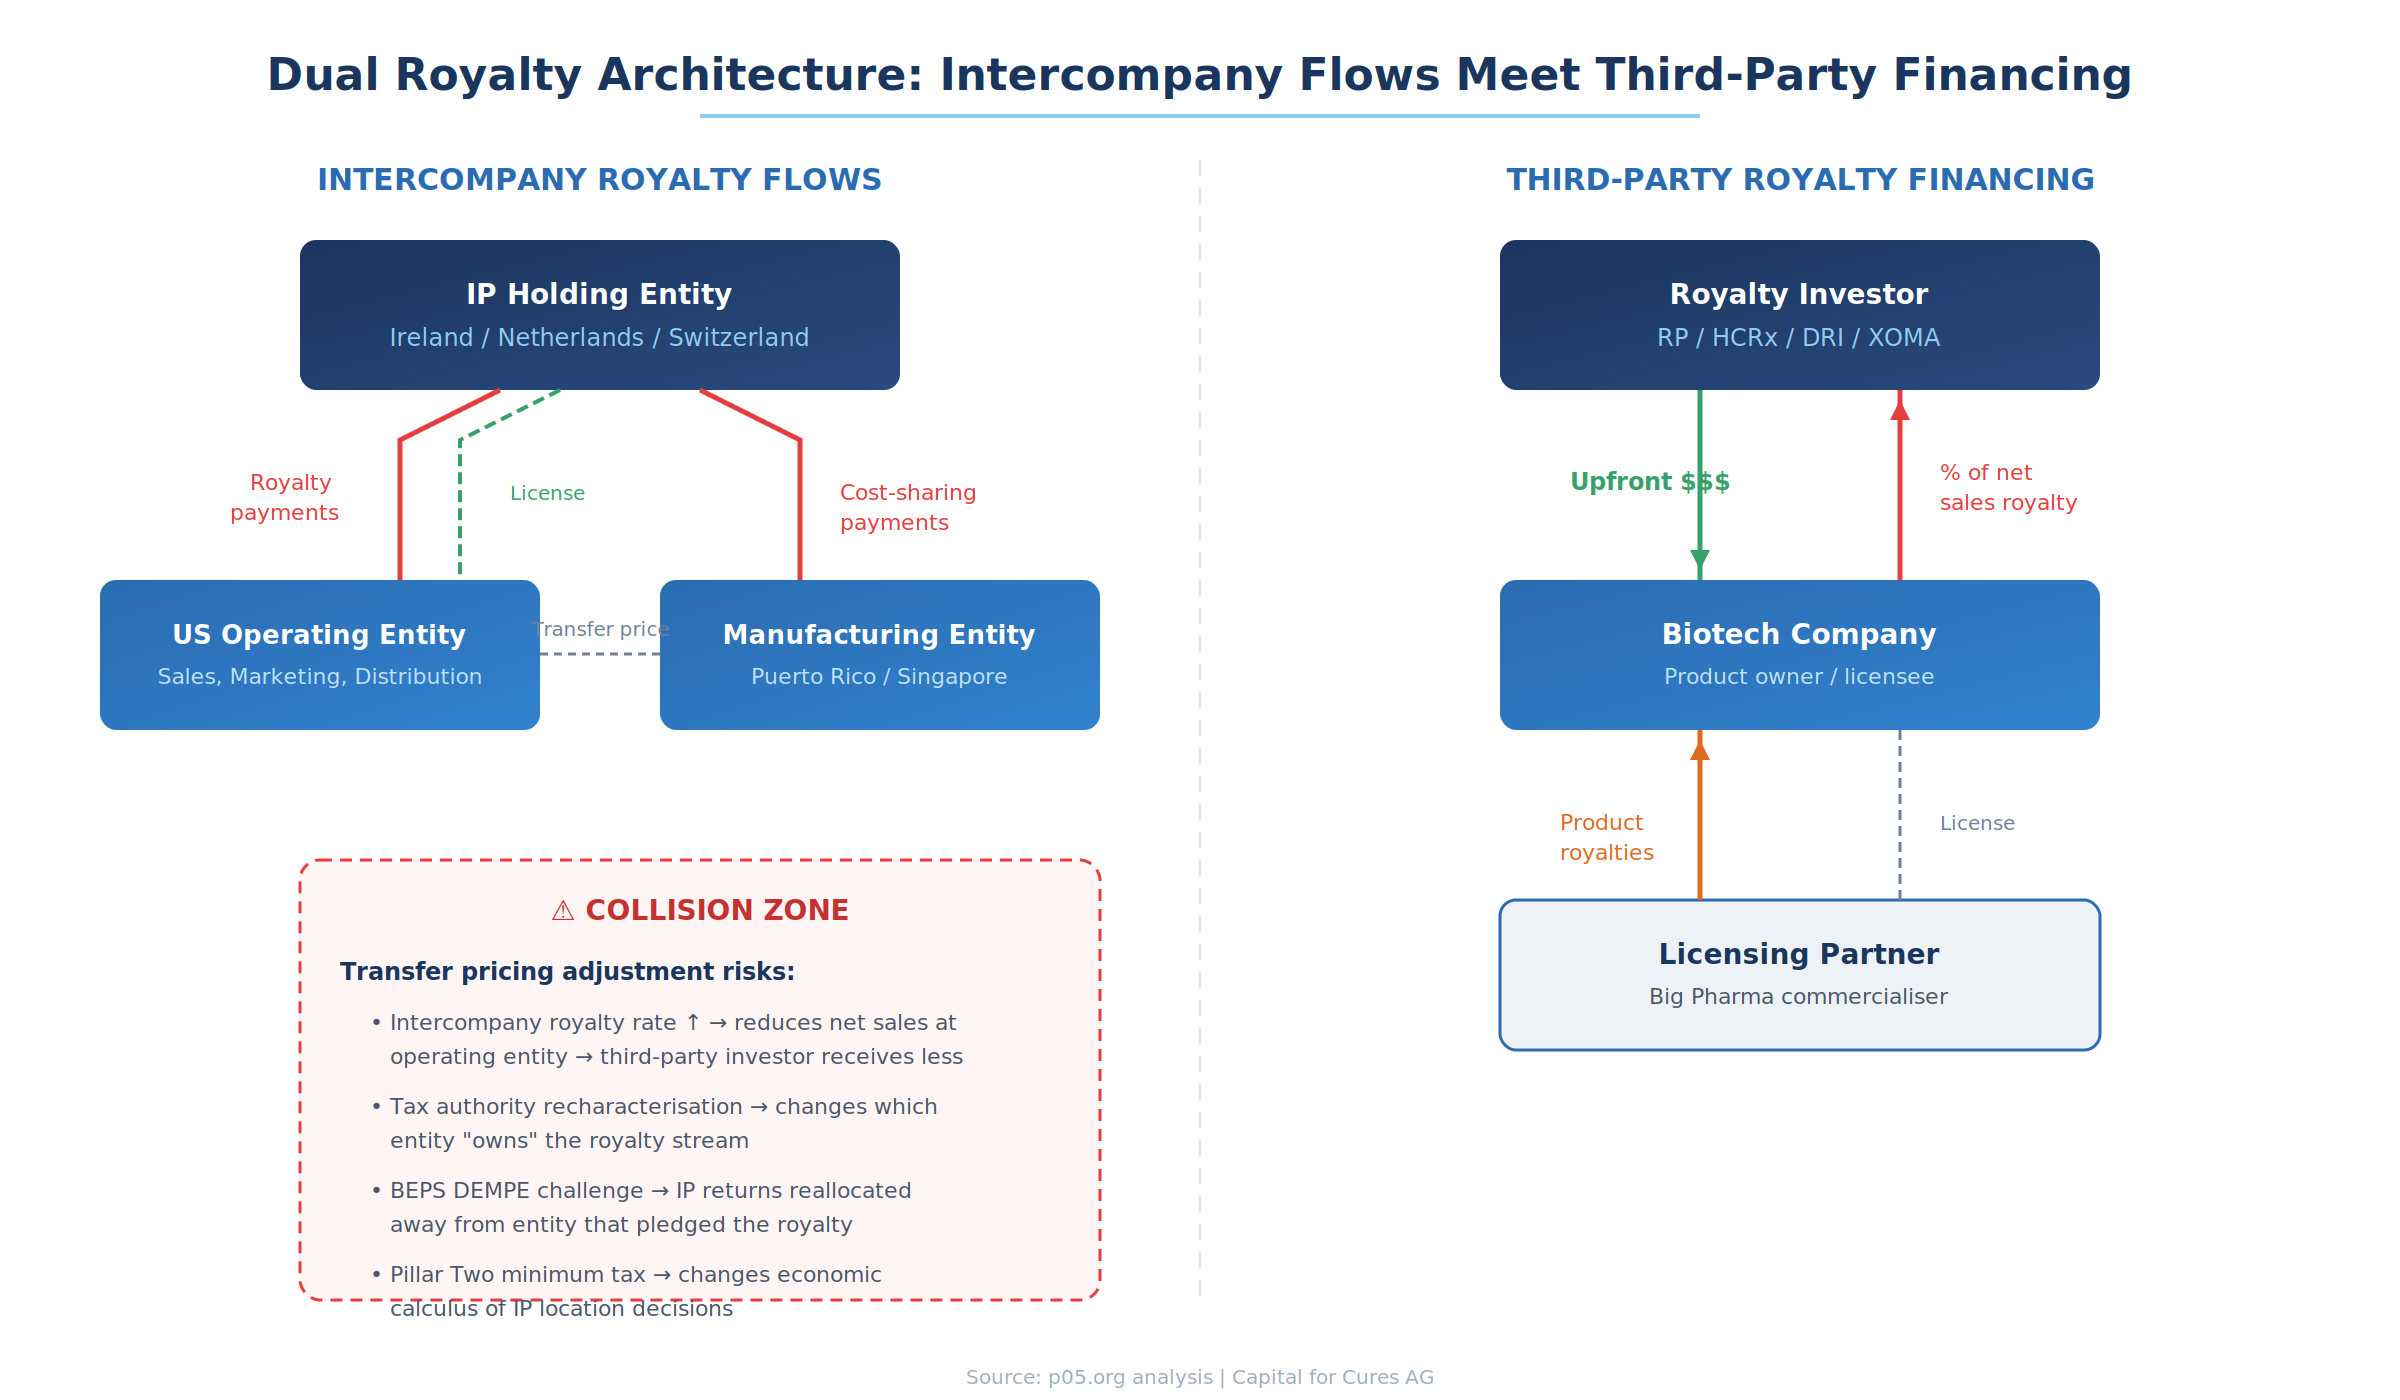
The Amgen case illuminates a collision that the pharmaceutical royalty financing market has been slow to internalise. On one side, multinational pharma companies use intercompany royalties to allocate profits across jurisdictions—often directing the lion's share of residual returns to low-tax IP holding entities in Ireland, Switzerland, Singapore, or Puerto Rico. On the other side, a growing market of third-party royalty investors—Royalty Pharma, HCRx, DRI Healthcare, XOMA—pays billions of dollars upfront for percentage claims on the very same product revenues that intercompany transfer prices determine. When tax authorities recharacterise those intercompany flows, the ripple effects can reach third-party investors whose returns depend on how much net revenue actually sits in the entity that pledged the royalty.
This article examines how intercompany royalty flows between affiliates interact with third-party royalty financing, the arm's-length pricing challenges unique to pharmaceuticals, and why the OECD's Base Erosion and Profit Shifting (BEPS) framework—from the 2015 Actions 8–10 intangibles guidance through to the ongoing Pillar One and Pillar Two reforms—is reshaping the risk landscape for every participant in the pharma royalty chain.
The Intercompany Royalty Architecture
The standard pharmaceutical MNE operates through a structure that tax practitioners euphemistically call "centralised IP management." A holding company in a favourable jurisdiction—historically Ireland, the Netherlands, Luxembourg, or Singapore—legally owns the group's pharmaceutical patents, trade secrets, and regulatory dossiers. Operating subsidiaries in market jurisdictions (the United States, Germany, Japan) sell the finished drugs to third parties but pay intercompany royalties or transfer prices to the IP holding company for the right to use the intellectual property.
The mechanics vary in form but converge in effect. Some groups use explicit licensing arrangements where the U.S. subsidiary pays a stated royalty rate (say, 40–60% of net sales) to the Irish IP holding entity. Others embed the royalty into the transfer price for finished goods: the Irish entity "sells" the drug to the U.S. distributor at a price that captures most of the margin, leaving the U.S. entity with a routine distribution return of 3–5% operating margin. Still others use cost-sharing agreements (CSAs) under which the IP entity funds a portion of R&D and receives a commensurate share of future profits.
The result is consistent across structures: the bulk of the group's pharmaceutical profits accumulate in a low-tax jurisdiction where the IP entity resides, while high-tax jurisdictions where drugs are actually sold and often developed report modest or even negative operating results.
AbbVie's structure illustrates the extreme case. Between 2014 and 2024, AbbVie's Irish subsidiaries—structured as unlimited companies with minimal public disclosure obligations—controlled the IP for Humira, Skyrizi, and Rinvoq. AbbVie's U.S. operations reported cumulative losses over the entire decade despite the United States accounting for more than half of global sales. The mechanism was intercompany royalty payments flowing from the U.S. entity to Ireland, where capital allowances for intangible assets and the headline 12.5% corporate rate (often further reduced by IP amortisation deductions) produced a foreign effective tax rate of approximately 2.9% on more than $115 billion of foreign earnings.
Where Intercompany and Third-Party Royalties Collide
The collision between intercompany transfer pricing and third-party royalty financing operates through several channels, each amplifying risk in ways that neither the company's tax department nor its royalty investor may have fully priced.
The Net Sales Definition Problem
Third-party royalty agreements typically entitle the investor to a percentage of "net sales" as defined in the agreement. But what constitutes net sales depends critically on the group's internal transfer pricing architecture. If the entity that pledged the royalty is a U.S. operating subsidiary that records gross product sales but pays 50% of those revenues upstream as intercompany royalties to an Irish IP entity, the question is whether the third-party investor's royalty base is calculated on the gross sales figure or the amount remaining after intercompany deductions.
Sophisticated royalty financing agreements address this by defining net sales at the third-party sales level—the price at which the drug is sold to external customers—rather than the intercompany transfer price. The KalVista–DRI Healthcare agreement and the Revolution Medicines–Royalty Pharma structure both anchor their royalty calculations to end-market sales, insulating the investor from internal pricing decisions. But not every agreement is drafted with this precision, and even well-drafted agreements can be disrupted when transfer pricing adjustments change which entity records the sale.
Entity Risk: Who "Owns" the Revenue?
A more fundamental risk emerges when transfer pricing restructurings change which entity within the group books the third-party revenue. Consider a scenario where a biotech licenses its drug to a Big Pharma partner, receives royalties from that partner, and then monetises those incoming royalties by selling a percentage to a royalty investor like HCRx or DRI. If the biotech subsequently restructures—transferring its license rights to a new Irish subsidiary under a cost-sharing arrangement—the royalty stream may technically flow to the Irish entity rather than the U.S. entity that originally pledged it to the investor.
This structural risk is analogous to the change-of-control triggers I discussed recently, but with a tax-driven twist. The restructuring is not prompted by M&A but by transfer pricing optimisation. Investors who fail to anticipate this risk may find their contractual claim is technically intact but economically subordinated to intercompany obligations that take priority in the cash flow waterfall.
Transfer Pricing Adjustments as Credit Events
When a tax authority successfully challenges a company's intercompany royalty rate—asserting that the true arm's-length rate should be 25% rather than 50%, for example—the adjustment retroactively reallocates profits between affiliates. For the entity paying the royalty, taxable income increases; for the entity receiving it, taxable income decreases.
This reallocation can interact with third-party royalty obligations in several ways. If the royalty investor's claim is calculated as a percentage of the paying entity's net sales, an upward adjustment to that entity's profits (from reduced intercompany royalty payments) could paradoxically increase the base on which the third-party royalty is calculated. Conversely, if the investor's claim attaches to the receiving entity's revenues, a downward adjustment to intercompany royalties flowing into that entity reduces the investor's economic interest.
The Amgen case provides a stark illustration of the magnitudes involved. The IRS proposed increasing Amgen's U.S. taxable income by over $23 billion for 2010–2015—alleging that too much profit had been allocated to the Puerto Rican manufacturing subsidiary through below-market transfer prices. Amgen argues that AML's contribution of complex biologics manufacturing, process know-how, and $4 billion in capital investment justifies a meaningful share of product profits. The IRS counters that the IP was developed and is controlled from the U.S., and that AML's share should reflect a routine contract manufacturing return.
If a third-party royalty investor had purchased a royalty stream tied to Amgen's U.S. net sales of specific biologics, the resolution of this dispute would directly affect their returns—a transfer pricing adjustment that inflates U.S.-reported income would correspondingly expand the royalty base.
BEPS and the Rewriting of Intercompany Rules
The OECD's Base Erosion and Profit Shifting project, launched in 2013 and producing its first comprehensive package in 2015, represents the most significant overhaul of international transfer pricing rules in a generation. For pharmaceuticals—an industry where intangible assets drive the vast majority of enterprise value—the implications are particularly acute.
Actions 8–10: DEMPE and the End of Passive IP Ownership
The most consequential BEPS reform for pharma intercompany royalties is the DEMPE framework introduced in Actions 8–10. Under the pre-BEPS regime, the legal owner of pharmaceutical IP was generally entitled to the residual profit from that IP's exploitation, even if the IP holding entity was a shell company in a low-tax jurisdiction with no employees, no laboratories, and no decision-making capacity. The entity simply needed to be the registered owner of the patent.
BEPS Actions 8–10 fundamentally changed this calculus. The revised OECD Transfer Pricing Guidelines now require that returns from intangibles be allocated to entities that perform the DEMPE functions—Development, Enhancement, Maintenance, Protection, and Exploitation—rather than entities that merely hold legal title. A shell IP holding company in Ireland that neither develops drugs nor makes strategic decisions about their commercialisation is entitled to "no or minimal residual profit" under paragraph 6.54 of the Guidelines, regardless of where the patent is registered.
The implications for pharma are profound. A typical pharmaceutical intangible—a granted patent covering a novel biologic, supported by clinical trial data, regulatory approvals, manufacturing know-how, and marketing authorisations—involves DEMPE functions scattered across multiple jurisdictions. R&D scientists in Cambridge (Massachusetts or England) develop the molecule. Manufacturing engineers in Puerto Rico or Singapore optimise the production process. Regulatory affairs specialists in Washington, London, and Tokyo maintain the approvals. Marketing teams in every major market exploit the commercial potential. Patent lawyers in multiple jurisdictions protect the IP.
The question that DEMPE forces is whether the entity collecting intercompany royalties actually performed or controlled the key value-creating functions. If it did not—if it is merely a contractual conduit that registered the IP and outsourced all substantive work to affiliates—then the intercompany royalty it charges may be indefensible under the arm's-length principle.
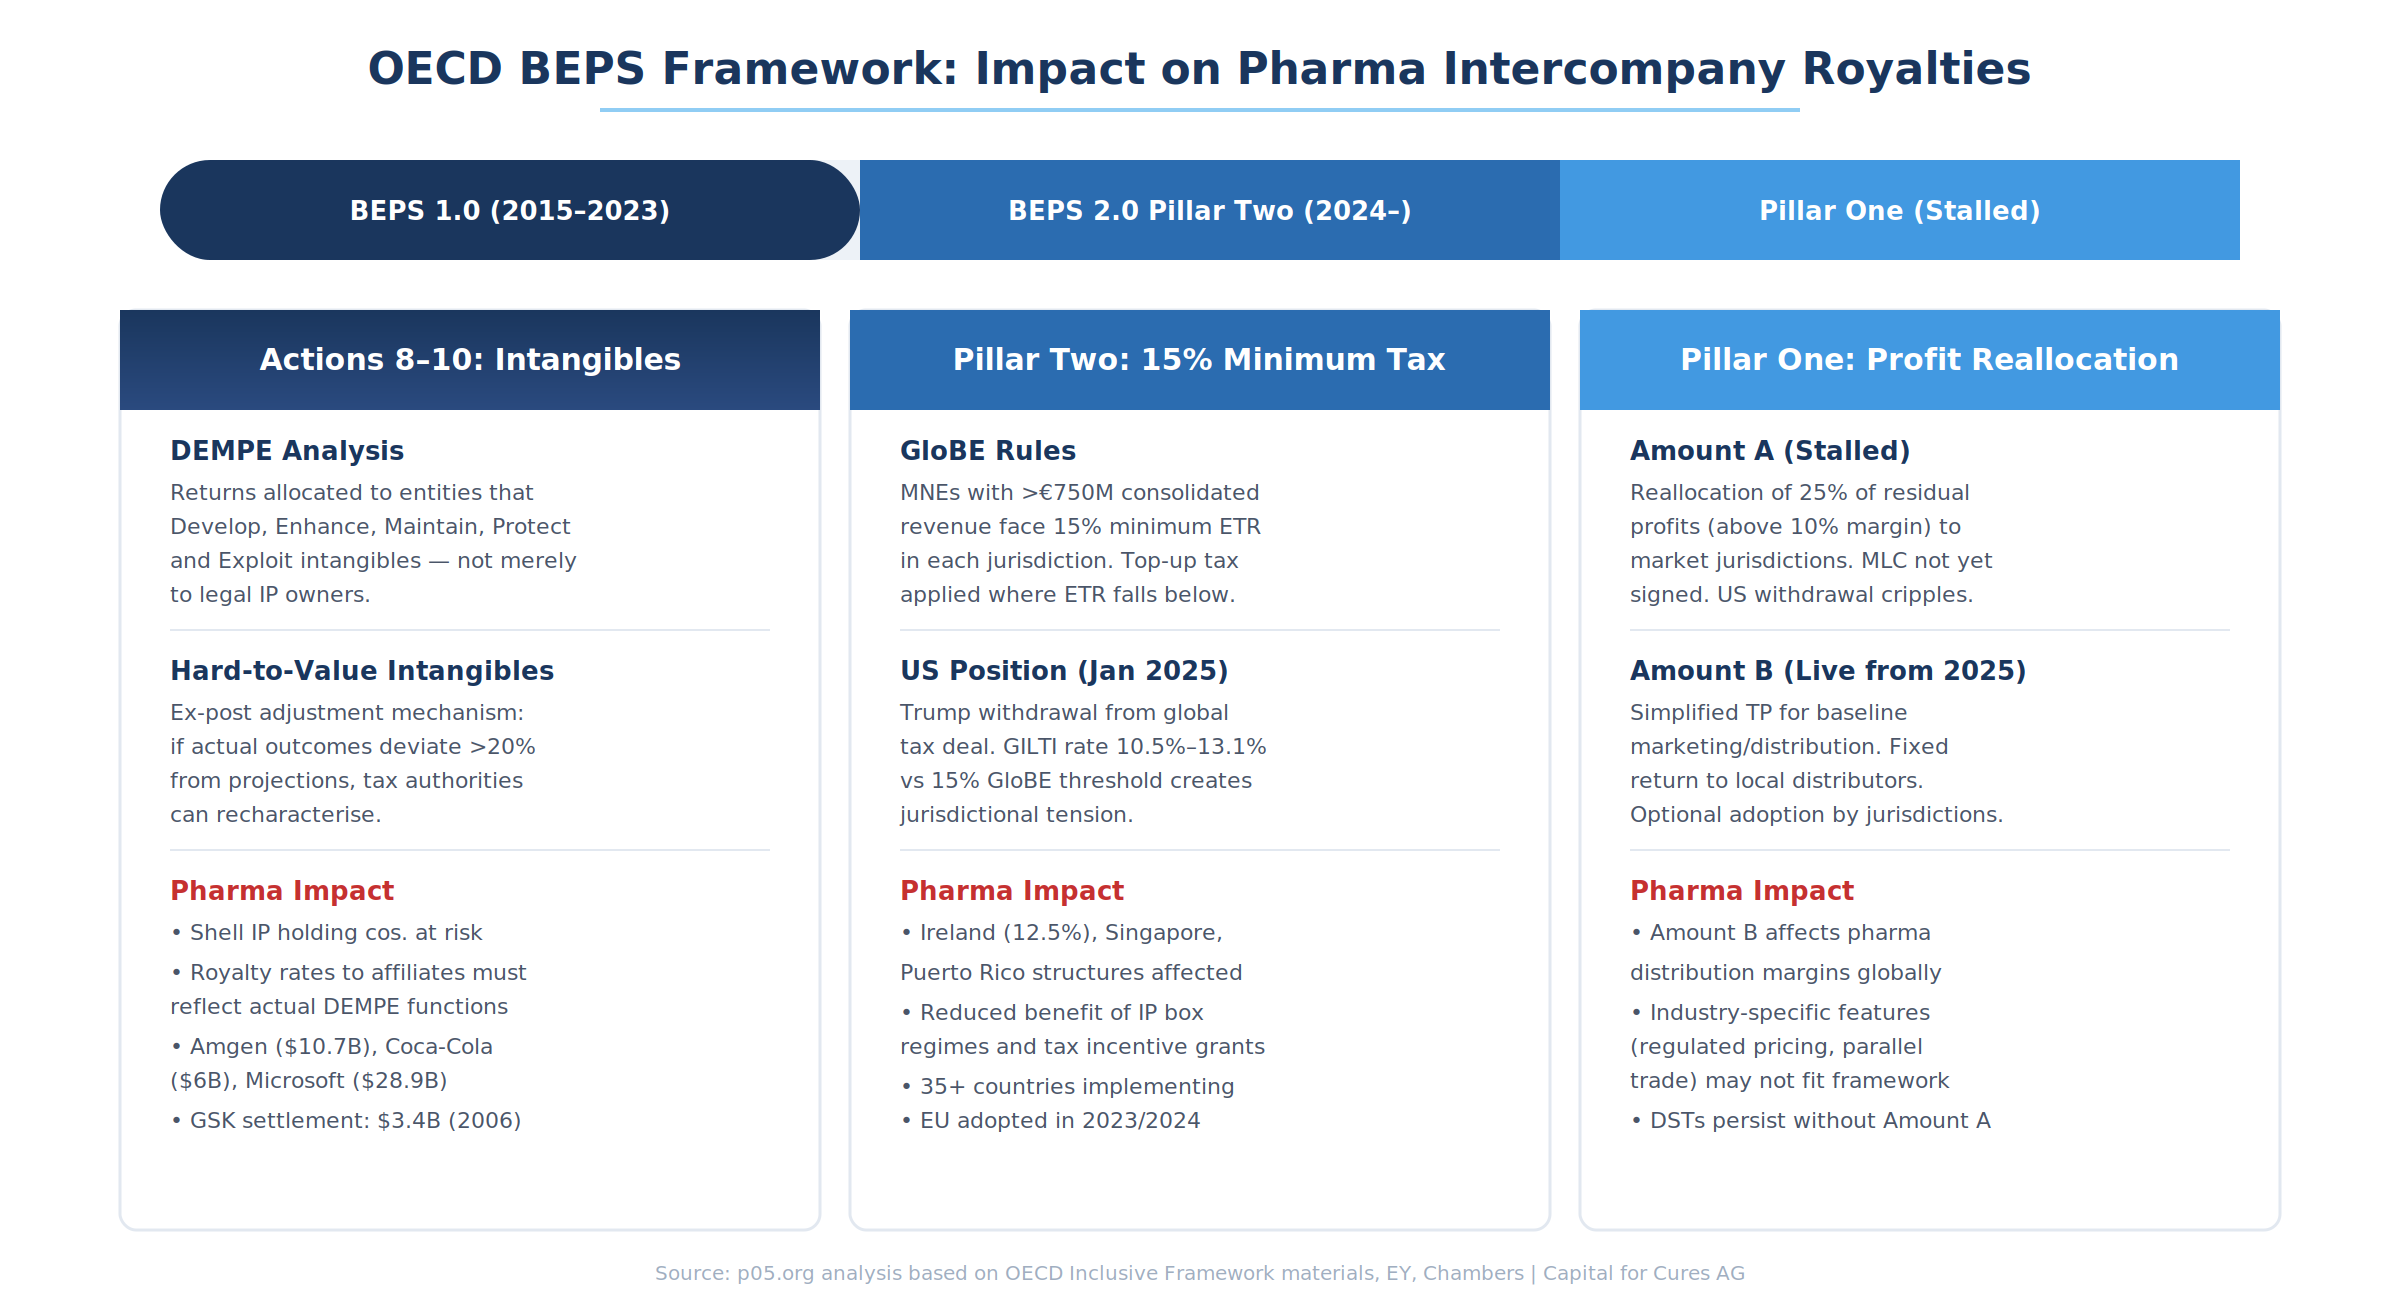
Hard-to-Value Intangibles
The BEPS Action 8 guidance on "hard-to-value intangibles" (HTVI) introduces an ex-post adjustment mechanism that is particularly relevant to pharmaceutical IP. Under the HTVI approach, if actual outcomes diverge significantly from the projections used to price an intangible transfer at the time of the transaction, tax authorities may use the actual outcomes as presumptive evidence that the original pricing was not arm's length.
For pharmaceutical IP, where blockbuster outcomes routinely exceed initial projections by orders of magnitude, this creates a persistent risk of retrospective adjustment. A patent licensed to an Irish subsidiary at a rate based on conservative Phase II data might look dramatically underpriced five years later when the drug achieves peak sales of $5 billion annually. Tax authorities in the jurisdiction where the drug was developed can invoke the HTVI approach to argue that the original transfer was below market value.
The HTVI guidance provides a safe harbour where the pricing was based on reliable projections and subsequent developments were "unforeseeable." But in pharma, where the difference between a $500 million drug and a $5 billion drug often comes down to clinical trial outcomes and competitive dynamics that are inherently uncertain, the boundaries of "foreseeability" are vigorously contested.
Pillar Two: The 15% Floor Changes the Calculus
The Pillar Two GloBE rules, which impose a 15% minimum effective tax rate on MNEs with consolidated revenues exceeding €750 million, represent a qualitatively different kind of reform from BEPS Actions 8–10. Rather than debating where profits should be allocated, Pillar Two establishes a floor below which no jurisdiction's effective rate should fall.
For pharmaceutical companies whose structures have historically produced blended effective tax rates of 8–12%, Pillar Two forces a recalculation. Ireland's 12.5% headline rate, already close to the 15% threshold before accounting for IP amortisation deductions, may produce effective rates below 15% once generous capital allowances for intangible assets are factored in. Puerto Rico's tax incentive grants and Singapore's pioneer certificates face similar scrutiny.
The practical effect is to reduce the marginal benefit of routing intercompany royalties through low-tax jurisdictions. If the top-up tax mechanism ensures the group pays at least 15% in every jurisdiction regardless, the motivation to maintain aggressive intercompany royalty structures diminishes—though it does not disappear entirely, since the difference between 15% and 25% (the U.S. combined statutory rate) remains substantial.
The political landscape has shifted dramatically. In January 2025, the Trump administration withdrew the United States from the OECD global tax deal, declaring it has "no force or effect" domestically. The One Big Beautiful Bill Act, signed into law on 4 July 2025, then overhauled the U.S. international minimum tax regime—renaming GILTI (Global Intangible Low-Taxed Income) to NCTI (Net CFC Tested Income), eliminating the qualified business asset investment (QBAI) carveout, reducing the Section 250 deduction to 40%, and raising the foreign tax credit haircut to 90%. The result is an effective NCTI rate of 12.6%, rising to a top rate of approximately 14% after foreign tax credit treatment—up from the prior 10.5% floor. For pharma companies with CFCs in jurisdictions taxing at 14% or above, foreign tax credits may now fully offset U.S. NCTI liability.
In January 2026, the U.S. Treasury secured a "side-by-side" agreement with the OECD/G20 Inclusive Framework, under which U.S.-headquartered multinationals remain subject only to U.S. global minimum taxes (NCTI) and are exempt from Pillar Two's income inclusion rule and the undertaxed profits rule (UTPR). The agreement preserves the value of U.S. R&D credits and other Congressionally approved incentives. While this resolves the immediate conflict between NCTI and Pillar Two for U.S.-parented pharma groups, the divergence is significant: NCTI applies on a blended worldwide basis, while Pillar Two operates jurisdiction by jurisdiction. A pharma company that pays 20% in Ireland but 5% in Singapore faces a top-up under Pillar Two's country-by-country approach—but may face no additional NCTI liability if the blended foreign rate exceeds 14%. For royalty investors evaluating entity-level cash flows, this structural mismatch means the tax risk profile depends critically on whether the group is U.S.-parented or foreign-parented.
Pillar One Amount B: Standardising Distribution Returns
Pillar One Amount B, which jurisdictions can optionally adopt for fiscal years beginning on or after 1 January 2025, introduces a simplified and streamlined approach to transfer pricing for "baseline" marketing and distribution activities. For pharmaceutical companies, this could standardise the returns allocated to local distribution affiliates—the entities that typically sit at the bottom of the intercompany pricing chain.
However, the pharmaceutical industry presents specific challenges for Amount B's application. Regulated pricing environments (where government health authorities set or negotiate drug prices), parallel trade (where products arbitrage price differentials across EU markets), and the role of local medical science liaisons in generating clinical evidence for regulatory submissions all complicate the characterisation of pharmaceutical distribution as "baseline." Whether Amount B will apply to the pharmaceutical sector in a manner that produces outcomes consistent with the arm's-length principle remains an open question as jurisdictions consider implementation.
The Arm's-Length Pricing Challenge
The arm's-length principle—the bedrock of international transfer pricing—requires that intercompany transactions be priced as if conducted between independent parties under comparable circumstances. For pharmaceutical royalties, this principle confronts a fundamental problem: there are often no truly comparable transactions.
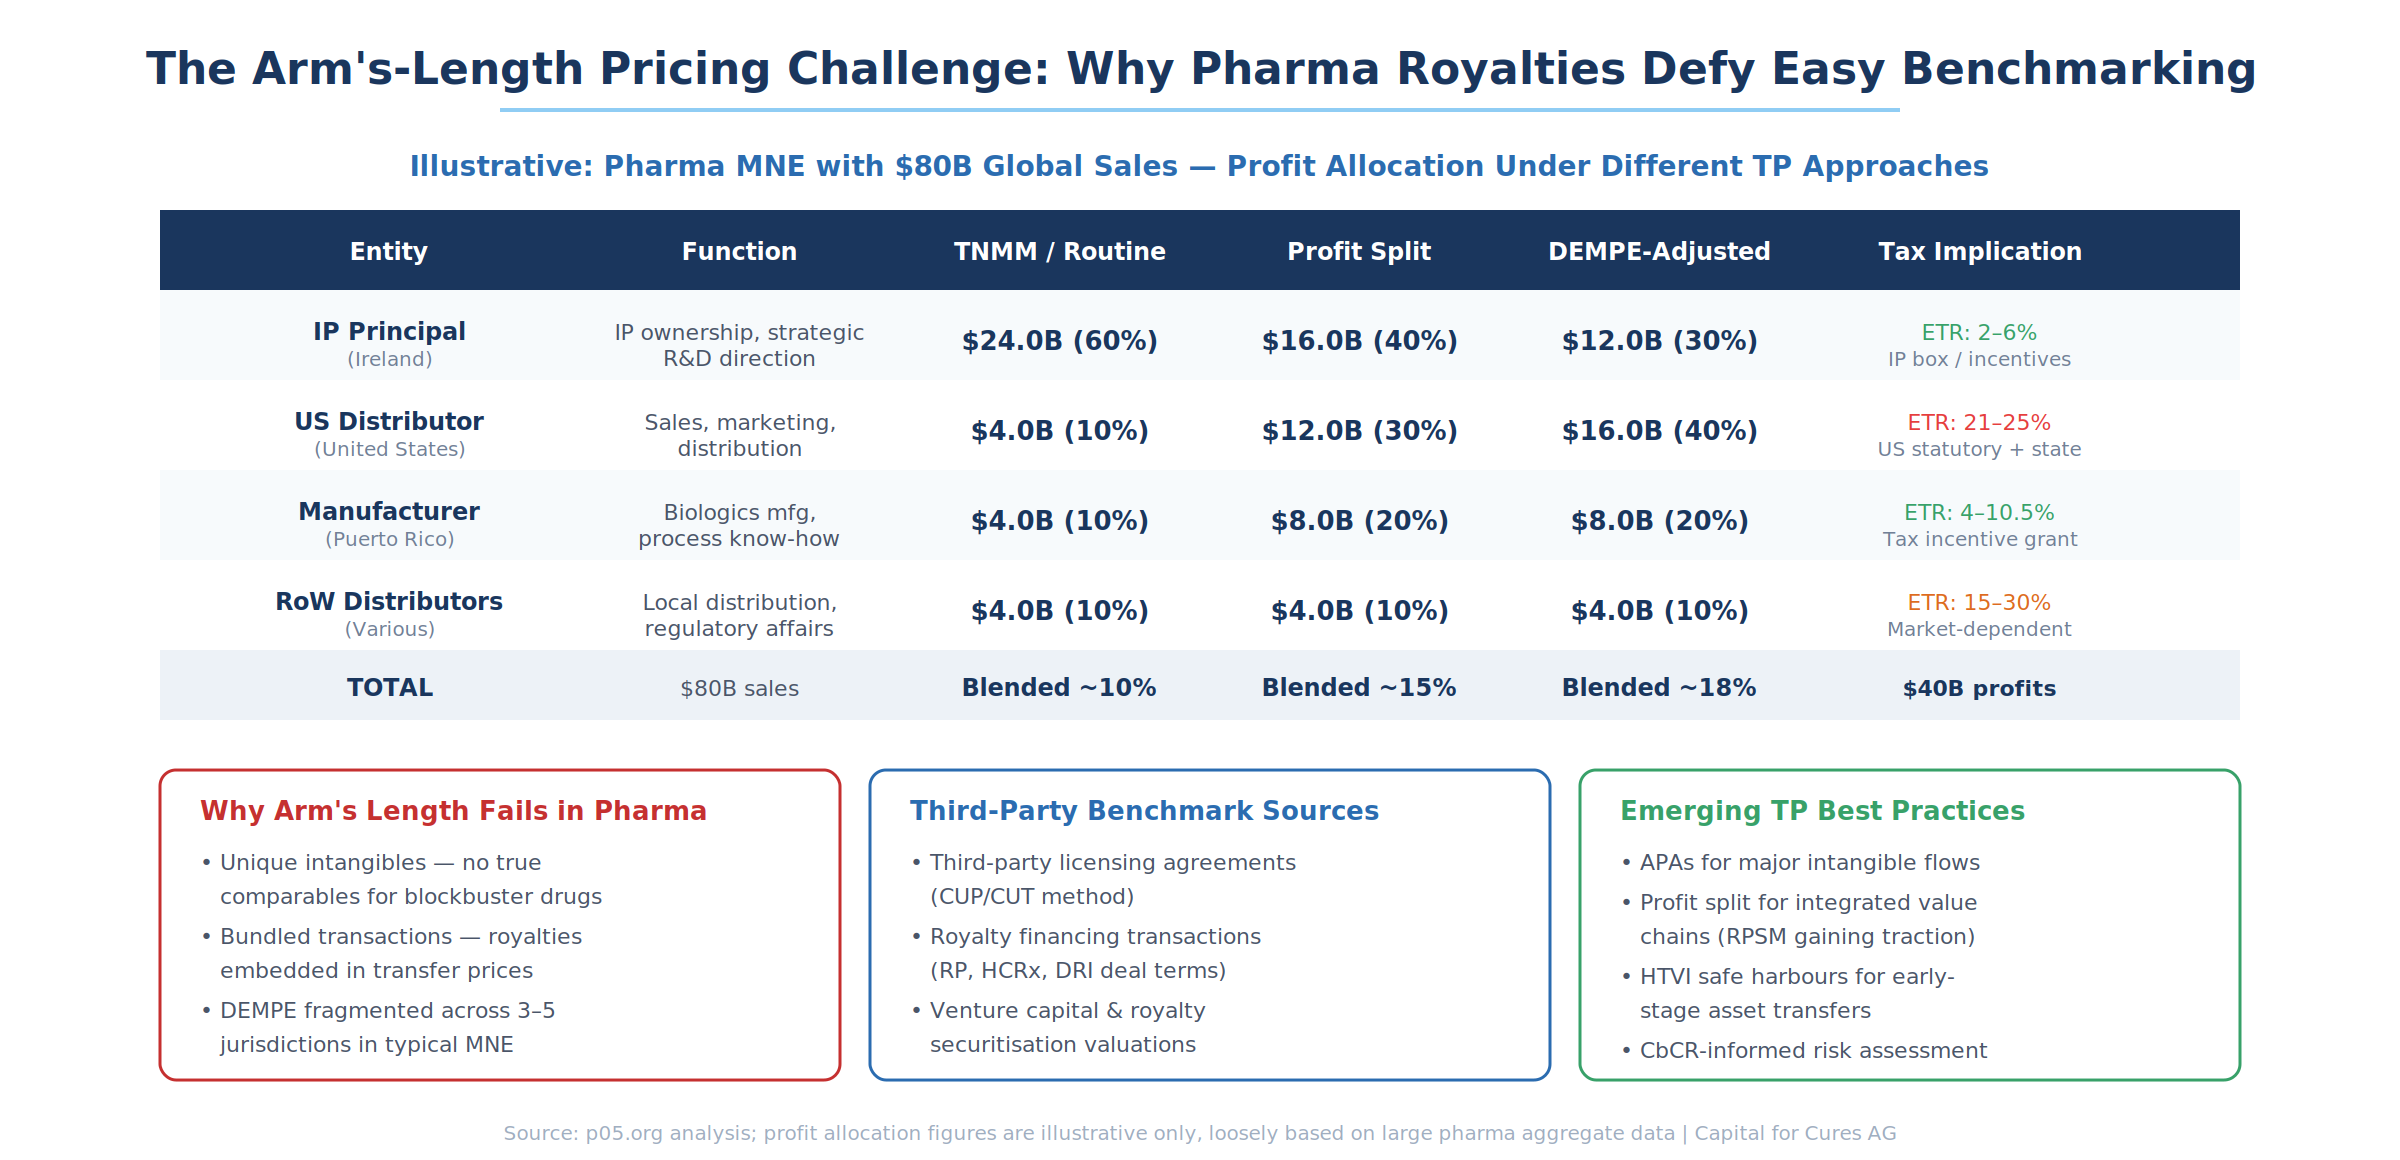
Why Pharma Intangibles Defy Benchmarking
A patent covering a first-in-class biologic for a rare disease is, by definition, unique. There is no comparable uncontrolled transaction (CUT) that precisely matches the intangible's characteristics: its therapeutic indication, competitive landscape, patent expiry profile, manufacturing complexity, and regulatory status. The database searches that transfer pricing practitioners conduct—looking for third-party licensing agreements involving similar molecules, similar indications, similar geographies—inevitably produce results that differ in material ways from the controlled transaction.
The pharmaceutical industry's transactional intensity compounds the problem. One study in the International Transfer Pricing Journal estimated that for every 100 third-party sales, pharmaceutical MNEs conduct approximately 122 intercompany transactions—reflecting the fragmented manufacturing, distribution, and licensing chains through which drugs reach patients. Each intercompany transaction requires an arm's-length price, and the prices must be internally consistent: the royalty rate paid by a U.S. distributor to an Irish IP entity must be reconcilable with the cost-plus margin paid to a Puerto Rican manufacturer, which in turn must be consistent with the cost-sharing contributions made by the Irish entity to fund ongoing R&D at the U.S. parent.
The Methods Landscape
Five transfer pricing methods dominate pharmaceutical practice, each with limitations:
The Comparable Uncontrolled Price (CUP) / Comparable Uncontrolled Transaction (CUT) method is the most direct but hardest to apply. It requires identifying third-party licensing agreements that are genuinely comparable to the intercompany license. Databases like RoyaltyRange and RoyaltyStat provide searchable repositories of licensing agreements, and third-party royalty financing transactions (deals by Royalty Pharma, HCRx, DRI) offer additional data points. But comparability adjustments for differences in product risk, exclusivity, territory, and contract duration can dwarf the underlying rate, making the analysis more art than science.
The Transactional Net Margin Method (TNMM), or its U.S. equivalent the Comparable Profits Method (CPM), assigns the "tested party" (typically the least complex entity) a routine return based on comparable companies, with residual profits flowing to the IP owner. This is the workhorse method for pharmaceutical distribution affiliates—the Brazilian subsidiary gets a 5% operating margin benchmarked against independent distributors, while the remaining 95% of operating profit flows upstream. The method is administratively convenient but essentially assumes the answer it purports to derive: the IP entity gets whatever is left after routine returns are allocated to everyone else.
The Residual Profit Split Method (RPSM) allocates routine returns to each entity first, then splits residual profits based on relative contributions to value creation. This method is gaining traction in pharma because it can accommodate the fragmented DEMPE reality—U.S. R&D contributes one portion of residual value, Irish IP ownership another, Puerto Rican manufacturing know-how a third. But agreeing on the relative contribution percentages is contentious, and the method requires detailed functional analysis that is expensive to prepare and difficult for tax authorities to audit.
Discounted Cash Flow (DCF) and Monte Carlo simulation approaches are used for valuing intangibles at the time of transfer—when IP is moved from a U.S. parent to an Irish subsidiary, for example. These methods require assumptions about future sales trajectories, discount rates, probability of success, and competitive dynamics that are inherently uncertain in pharmaceuticals. The HTVI rules described above create additional risk that valuations deemed reasonable at inception may be challenged ex post when actual outcomes materialise.
Third-Party Royalty Financing as a Benchmarking Tool
An underappreciated implication of the growing pharmaceutical royalty financing market is its potential to provide arm's-length benchmarks for intercompany royalty rates. When Royalty Pharma pays $2 billion to acquire a synthetic royalty of 7.5% on a marketed biologic, and DRI Healthcare pays $100 million for a royalty of 8–10% on a clinical-stage asset, these transactions represent genuine negotiations between unrelated parties over the value of pharmaceutical cash flows.
Third-party royalty financing transactions are not perfect comparables for intercompany licenses—the royalty investor takes a different risk profile (financial risk) than an operating licensee (commercial and regulatory risk). But the transaction evidence is valuable precisely because it reflects market-clearing rates for pharmaceutical revenue streams. The OECD Transfer Pricing Guidelines' own observation that "capital investments at risk can attract remunerations based on third-party sales without a major control over DEMPE functions" acknowledges the relevance of this transaction class as benchmark evidence.
For royalty investors, the mirror image applies: intercompany transfer pricing documentation prepared by pharmaceutical companies—often running to thousands of pages of functional analysis, comparability studies, and economic modelling—can inform the investor's own valuation of the royalty stream. If the company's transfer pricing study assigns 60% of product value to the IP and 5% to distribution, the investor has a framework for understanding how cash flows are allocated within the group and where their royalty claim sits in the priority waterfall.
Case Studies in Collision
Amgen: $10.7 Billion and Counting
Amgen's dispute with the IRS, currently before the U.S. Tax Court, represents the highest-stakes test of pharmaceutical transfer pricing since the GlaxoSmithKline settlement of $3.4 billion in 2006. The fundamental issue is how to allocate profits between Amgen Inc. (U.S.) and Amgen Manufacturing Limited (Puerto Rico) for biologic drugs including Enbrel, Neulasta, and Epogen.
Amgen's position is that AML performs sophisticated biologics manufacturing—cultivating living cells in 20,000-litre bioreactors, managing complex purification processes, and contributing process patents and manufacturing know-how developed over three decades with $4 billion in capital investment and 2,400 employees. Under DEMPE principles, AML's contribution to the "Enhancement" and "Maintenance" functions justifies a substantial share of residual profits, not merely a contract manufacturing return.
The IRS's position is that the critical value-creating functions—drug discovery, clinical development, regulatory strategy, and commercial direction—were performed in the United States by Amgen Inc. Under the IRS's analysis, AML deserves at most a routine manufacturing return, and the intercompany license rate that Amgen applied overstated AML's contribution by billions of dollars annually. The IRS initially applied a Comparable Profit Split Method combined with a CUT method that would have left AML with cumulative losses of nearly $2 billion over six years—a result that Amgen characterises as "completely unmoored from what third parties would pay at arm's length."
The case has triggered a parallel securities class action, with investors alleging that Amgen failed to adequately disclose the $10.7 billion exposure in its SEC filings. The company had described the IRS's positions as "without merit" without quantifying the potential liability—a disclosure practice that a federal judge ruled in September 2024 could constitute a material omission.
For the royalty financing market, Amgen illustrates the scale at which transfer pricing disputes operate. A $10.7 billion adjustment to a single company's intercompany pricing represents more value at risk than the entire annual volume of pharma royalty financing transactions. If a third-party royalty investor had exposure to Amgen's product revenues through a royalty or synthetic royalty arrangement, the outcome of this dispute—and the corresponding recharacterisation of where profits sit—would materially affect their returns.
AbbVie: The Unlimited Company Labyrinth
AbbVie's Irish structure demonstrates how intercompany royalties can produce sustained negative results in a company's home jurisdiction. Between 2014 and 2024, AbbVie reported cumulative U.S. operating losses despite Humira being the best-selling drug in the United States during most of that period. The mechanism: intercompany payments—particularly royalties flowing from U.S. operations to Irish IP holding entities—systematically shifted earnings offshore.
AbbVie's Irish subsidiaries are structured as unlimited companies, which under Irish law are exempt from filing public consolidated accounts. This opacity shields the intercompany royalty arrangements from external scrutiny. But for a hypothetical third-party royalty investor examining AbbVie's U.S. operating entity as a potential royalty source, the implications are sobering: the U.S. entity that generates over half of global sales and would naturally be the royalty-paying entity shows persistent losses precisely because of intercompany obligations that take priority over any external claims.
AbbVie's foreign effective tax rate of approximately 2.9% over the decade invites the question of whether its transfer pricing will survive BEPS-era scrutiny. The DEMPE framework would require demonstrating that the Irish entities—several with fewer than 100 employees—actually perform or control the functions that justify capturing 95% or more of global pharmaceutical profits. As Pillar Two's 15% minimum rate takes effect in implementing jurisdictions, the marginal benefit of maintaining this structure diminishes—but does not disappear entirely for sales in jurisdictions where the local rate exceeds 15%.
GlaxoSmithKline: The Original Pharma TP Megacase
The 2006 GlaxoSmithKline settlement of $3.4 billion in additional tax, penalties, and interest—the largest single transfer pricing settlement in history at the time—centred on the allocation of profits between GSK's U.K. and U.S. entities. HMRC and the IRS disputed how to value overlapping contributions to the development and commercialisation of blockbuster drugs. The settlement, reached before final judgment, highlighted the difficulty of applying any single transfer pricing method to integrated pharmaceutical value chains where R&D, manufacturing, and marketing contributions are deeply intertwined.
Two decades later, the GSK settlement remains relevant as a cautionary baseline. The amounts in dispute have grown by an order of magnitude—from $3.4 billion to $10.7 billion (Amgen) and $28.9 billion (Microsoft)—reflecting both the growth of pharmaceutical industry profits and the increasing aggressiveness of tax authorities emboldened by BEPS-era guidance.
Implications for Royalty Investors and Dealmakers
Due Diligence on Transfer Pricing Risk
Royalty investors conducting due diligence on a potential transaction must now assess transfer pricing architecture as a core risk factor alongside clinical, commercial, and legal risks. The key questions include: which entity within the MNE group actually books the third-party revenue that generates the royalty stream, whether that entity's intercompany pricing has been challenged or is likely to be challenged by tax authorities, whether the royalty agreement's definition of "net sales" is insulated from intercompany pricing changes, and whether a potential transfer pricing restructuring could move the revenue-generating activities (and the associated cash flows) to a different entity than the one that pledged the royalty.
Contract Structuring
Several contract provisions can mitigate transfer pricing risk in royalty financing agreements. Anti-restructuring covenants can prohibit the company from moving the IP or commercial operations that generate the royalty stream to a different entity without investor consent—functionally similar to the change-of-control triggers that protect against M&A risk but targeted at tax-driven restructurings. Net sales definitions that anchor to end-customer sales rather than intercompany transfer prices insulate the royalty base from internal pricing changes. Tax gross-up provisions can shift the economic cost of withholding tax on cross-border royalty payments to the company, preventing the investor's returns from being eroded by tax obligations arising from the company's chosen intercompany structure. Step-in rights can allow the investor to assume control of the royalty stream if the company's transfer pricing is recharacterised in a way that impairs the investor's economic interest.
Valuation Adjustments
The interaction between transfer pricing and royalty financing suggests that investors should apply a "transfer pricing discount" when valuing royalty streams from companies with aggressive intercompany structures. If a company's U.S. operating entity reports negative margins due to intercompany royalty payments, the sustainability of those intercompany flows—and the corresponding stability of the entity's operating cash flows—is a legitimate valuation concern.
Conversely, a company whose transfer pricing has been validated through an Advance Pricing Agreement (APA) with the relevant tax authorities provides greater certainty that intercompany flows will remain stable. APAs, which typically cover three to five years and can be renewed, represent a tax authority's advance agreement that the company's transfer prices are arm's length. While not an absolute guarantee (APAs can be cancelled for misrepresentation), they significantly reduce the risk of retroactive adjustment.
The Road Ahead
The convergence of transfer pricing reform and pharmaceutical royalty financing is creating a regulatory environment of unprecedented complexity. BEPS Actions 8–10 have given tax authorities worldwide the tools—and the mandate—to challenge intercompany royalty structures that fail DEMPE analysis. Pillar Two's 15% minimum tax is eroding the economic rationale for maintaining IP in low-tax jurisdictions. Amount B may standardise distribution returns across implementing jurisdictions. And the bifurcation of the global minimum tax landscape—with U.S.-parented groups now subject to NCTI under the One Big Beautiful Bill Act while the rest of the world operates under Pillar Two's GloBE rules, linked only by the January 2026 side-by-side agreement—introduces a structural asymmetry that royalty investors must navigate.
For pharmaceutical companies, the era of frictionless profit shifting through intercompany royalties is ending—not with a single legislative act but through the cumulative effect of BEPS implementation, increased enforcement, and tax court victories that embolden revenue authorities. Companies that maintain aggressive structures now face not only tax risk but securities law exposure, as the Amgen class action demonstrates.
For royalty investors, transfer pricing risk is no longer a second-order concern buried in legal due diligence. It is a first-order economic risk that affects the quantum of cash flows available to service royalty obligations. In a market where transaction volumes exceed $15 billion annually and individual deals routinely surpass $1 billion, the interaction between intercompany tax architecture and third-party royalty claims demands sophisticated analysis and robust contractual protections.
The pharmaceutical royalty market has matured impressively over the past decade. Its next phase of evolution will require the same rigour applied to transfer pricing and international tax that has long characterised its approach to clinical risk, patent analysis, and financial structuring. The companies and investors who get this right will capture the economic value that the pharma royalty model was designed to unlock. Those who don't may find that the IRS—or its counterparts in Ireland, Germany, Australia, and beyond—has a prior claim.
All information in this report was accurate as of the research date and is derived from publicly available sources including company press releases, SEC filings, OECD publications, regulatory announcements, and financial news reporting. Information may have changed since publication. This content is for informational purposes only and does not constitute investment, legal, tax, or financial advice. The author is not a lawyer, tax adviser, or financial adviser.
Member discussion