Valuing Data the Way Wall Street Values Drug Royalties

Healthcare data stocks are getting destroyed in early 2026. IQVIA, the bellwether of pharmaceutical data and analytics, has fallen roughly 26% in February alone, trading around $167 per share — down from a 52-week high of $247. Tempus AI, the precision medicine data company that went public in 2024 to enormous fanfare, sits at approximately $52, half its 52-week high. Analyst price targets are being slashed across the board: UBS cut IQVIA to $240 from $280, Stifel to $220 from $273, JPMorgan to $225 from $255.
The selloff has been indiscriminate. IQVIA reported Q4 revenue of $4.36 billion, up 10% year-over-year, beating estimates. Tempus posted preliminary full-year 2025 revenue of approximately $1.27 billion, an 83% increase. The operational results are strong. The stock prices say otherwise.
This disconnect matters for anyone who values data assets — whether you are pricing an acquisition target, structuring a data licensing deal, or evaluating a proprietary database for investment. Public market multiples set the reference point for private transactions. When IQVIA trades at roughly 1.7× revenue (its total enterprise includes a large CRO business, which depresses the blended multiple), it sends a signal about how the market is pricing healthcare data infrastructure. When Tempus trades at approximately 7× revenue — down from 12–13× just months ago — the implied value of curated genomic and clinical data is resetting in real time.
The question is whether the market is right. This article lays out a practical framework — borrowed from pharmaceutical royalty finance — for answering that question.
The Structural Case for Data
The comparison between pharmaceutical royalties and data assets is structural, not rhetorical. Both generate recurring, predictable cash flows. Both are sensitive to competitive dynamics and eventual obsolescence. Both can be priced using the same fundamental toolkit: discounted cash flows, probability-weighted scenarios, comparable transaction analysis, and terminal value modeling.
| Characteristic | Pharmaceutical Royalty | Data Asset |
|---|---|---|
| Revenue model | Recurring % of product sales | Recurring subscription / licensing fee |
| Duration | Patent life / LOE (8–15 years) | Useful life of data (degrades without refresh) |
| Risk factors | Clinical failure, competition, generic entry | Obsolescence, commoditization, replication |
| Defensibility | IP protection, regulatory exclusivity | Proprietary collection, network effects, switching costs |
| Growth drivers | Label expansion, new indications | Data enrichment, new use cases, integrations |
| Terminal value | Generic cliff / royalty cap | Commoditization risk / platform lock-in |
| Marginal cost | Near zero (passive income) | Near zero (serves unlimited concurrent users) |
The critical structural difference — and the one that should matter most to investors — is that data assets do not face a patent cliff. A royalty on a branded oncology therapy will, with near-certainty, experience a sharp decline when the composition of matter patent expires. Data faces softer erosion: staleness, competitive replication, changing customer needs. But data can also compound in value through network effects, continuous enrichment, and expanding use cases in ways that a fixed royalty stream never can.
This is not a theoretical argument. It shows up in cash flow profiles, in terminal values, and in transaction multiples.
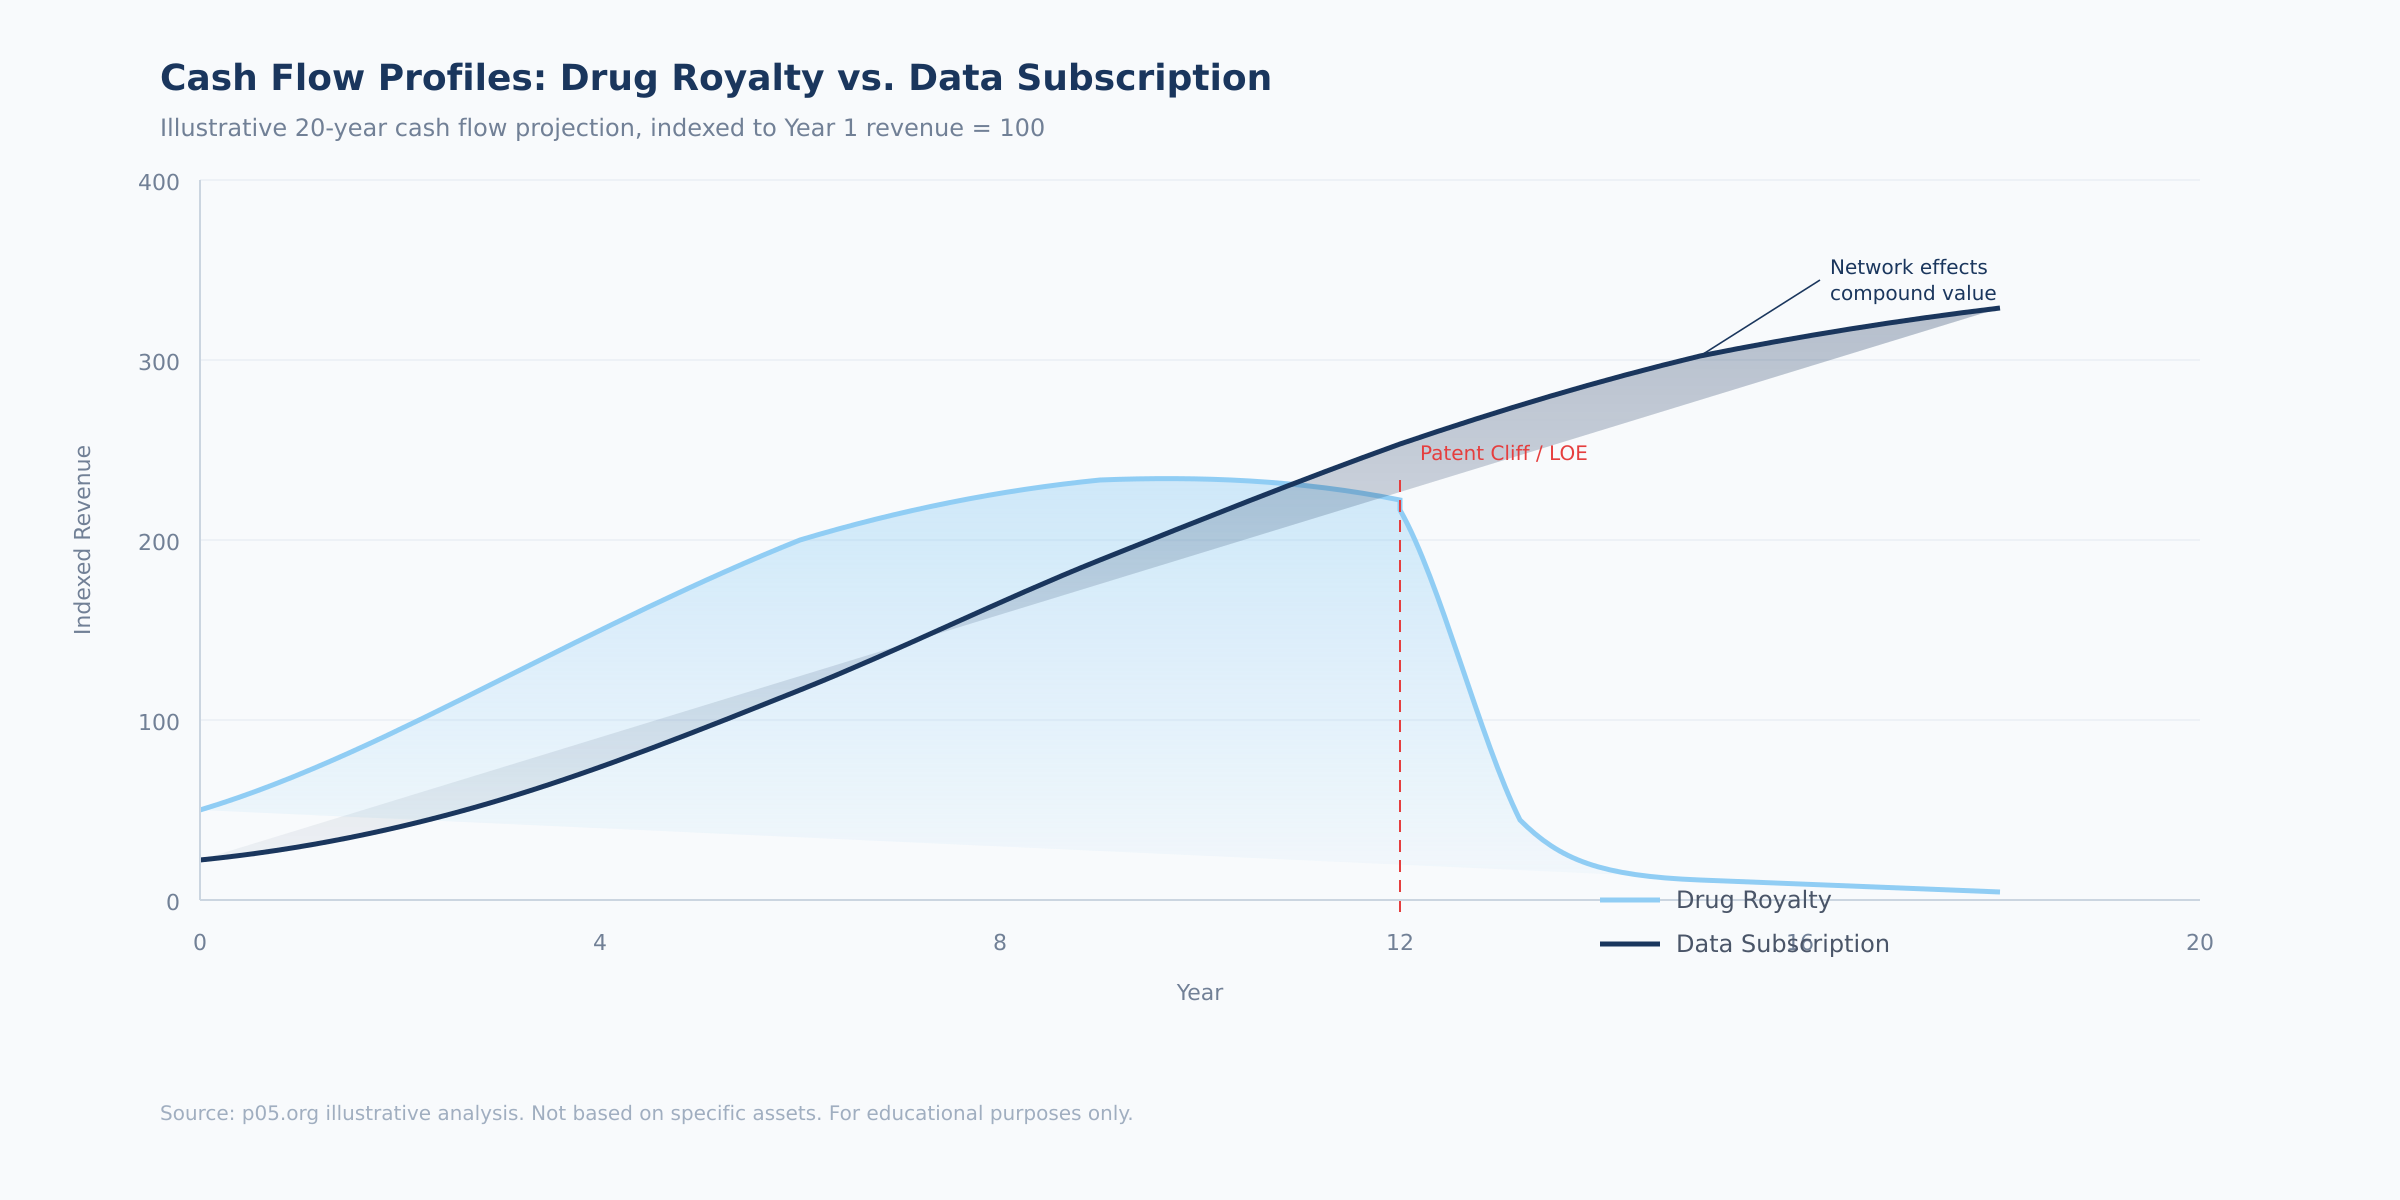
The chart above illustrates the fundamental divergence. A drug royalty rises with product adoption, peaks at patent maturity, and then falls sharply at loss of exclusivity — the patent cliff that dominates pharmaceutical royalty valuation. A data subscription follows a different trajectory: slower initial ramp, steady compounding, and — critically — no cliff. The absence of a hard expiry date is what makes terminal value analysis so different for data assets, and why data businesses with strong moats can justify multiples that exceed those of pharmaceutical royalties.
How to Value Data in Practice: A Step-by-Step Framework
The following framework adapts four tools from pharmaceutical royalty finance to data valuation. Each step is directly applicable to pricing a data asset — whether for an acquisition, an investment round, or internal capital allocation.
Step 1: Stage the Asset and Assign a Probability of Commercial Viability
The most direct transfer from royalty finance is staged probability weighting. Just as a drug progresses through clinical phases with increasing probability of reaching market, a data product moves through development stages with increasing probability of sustaining commercial revenue.
Most data projects fail — not in a dramatic Phase III sense, but in a slow, expensive way. Data is collected but turns out to be dirty or incomplete. A product is built but no one will pay for it. Early customers sign up but churn within a year. The failure modes differ from clinical trials, but the attrition rates are comparable.
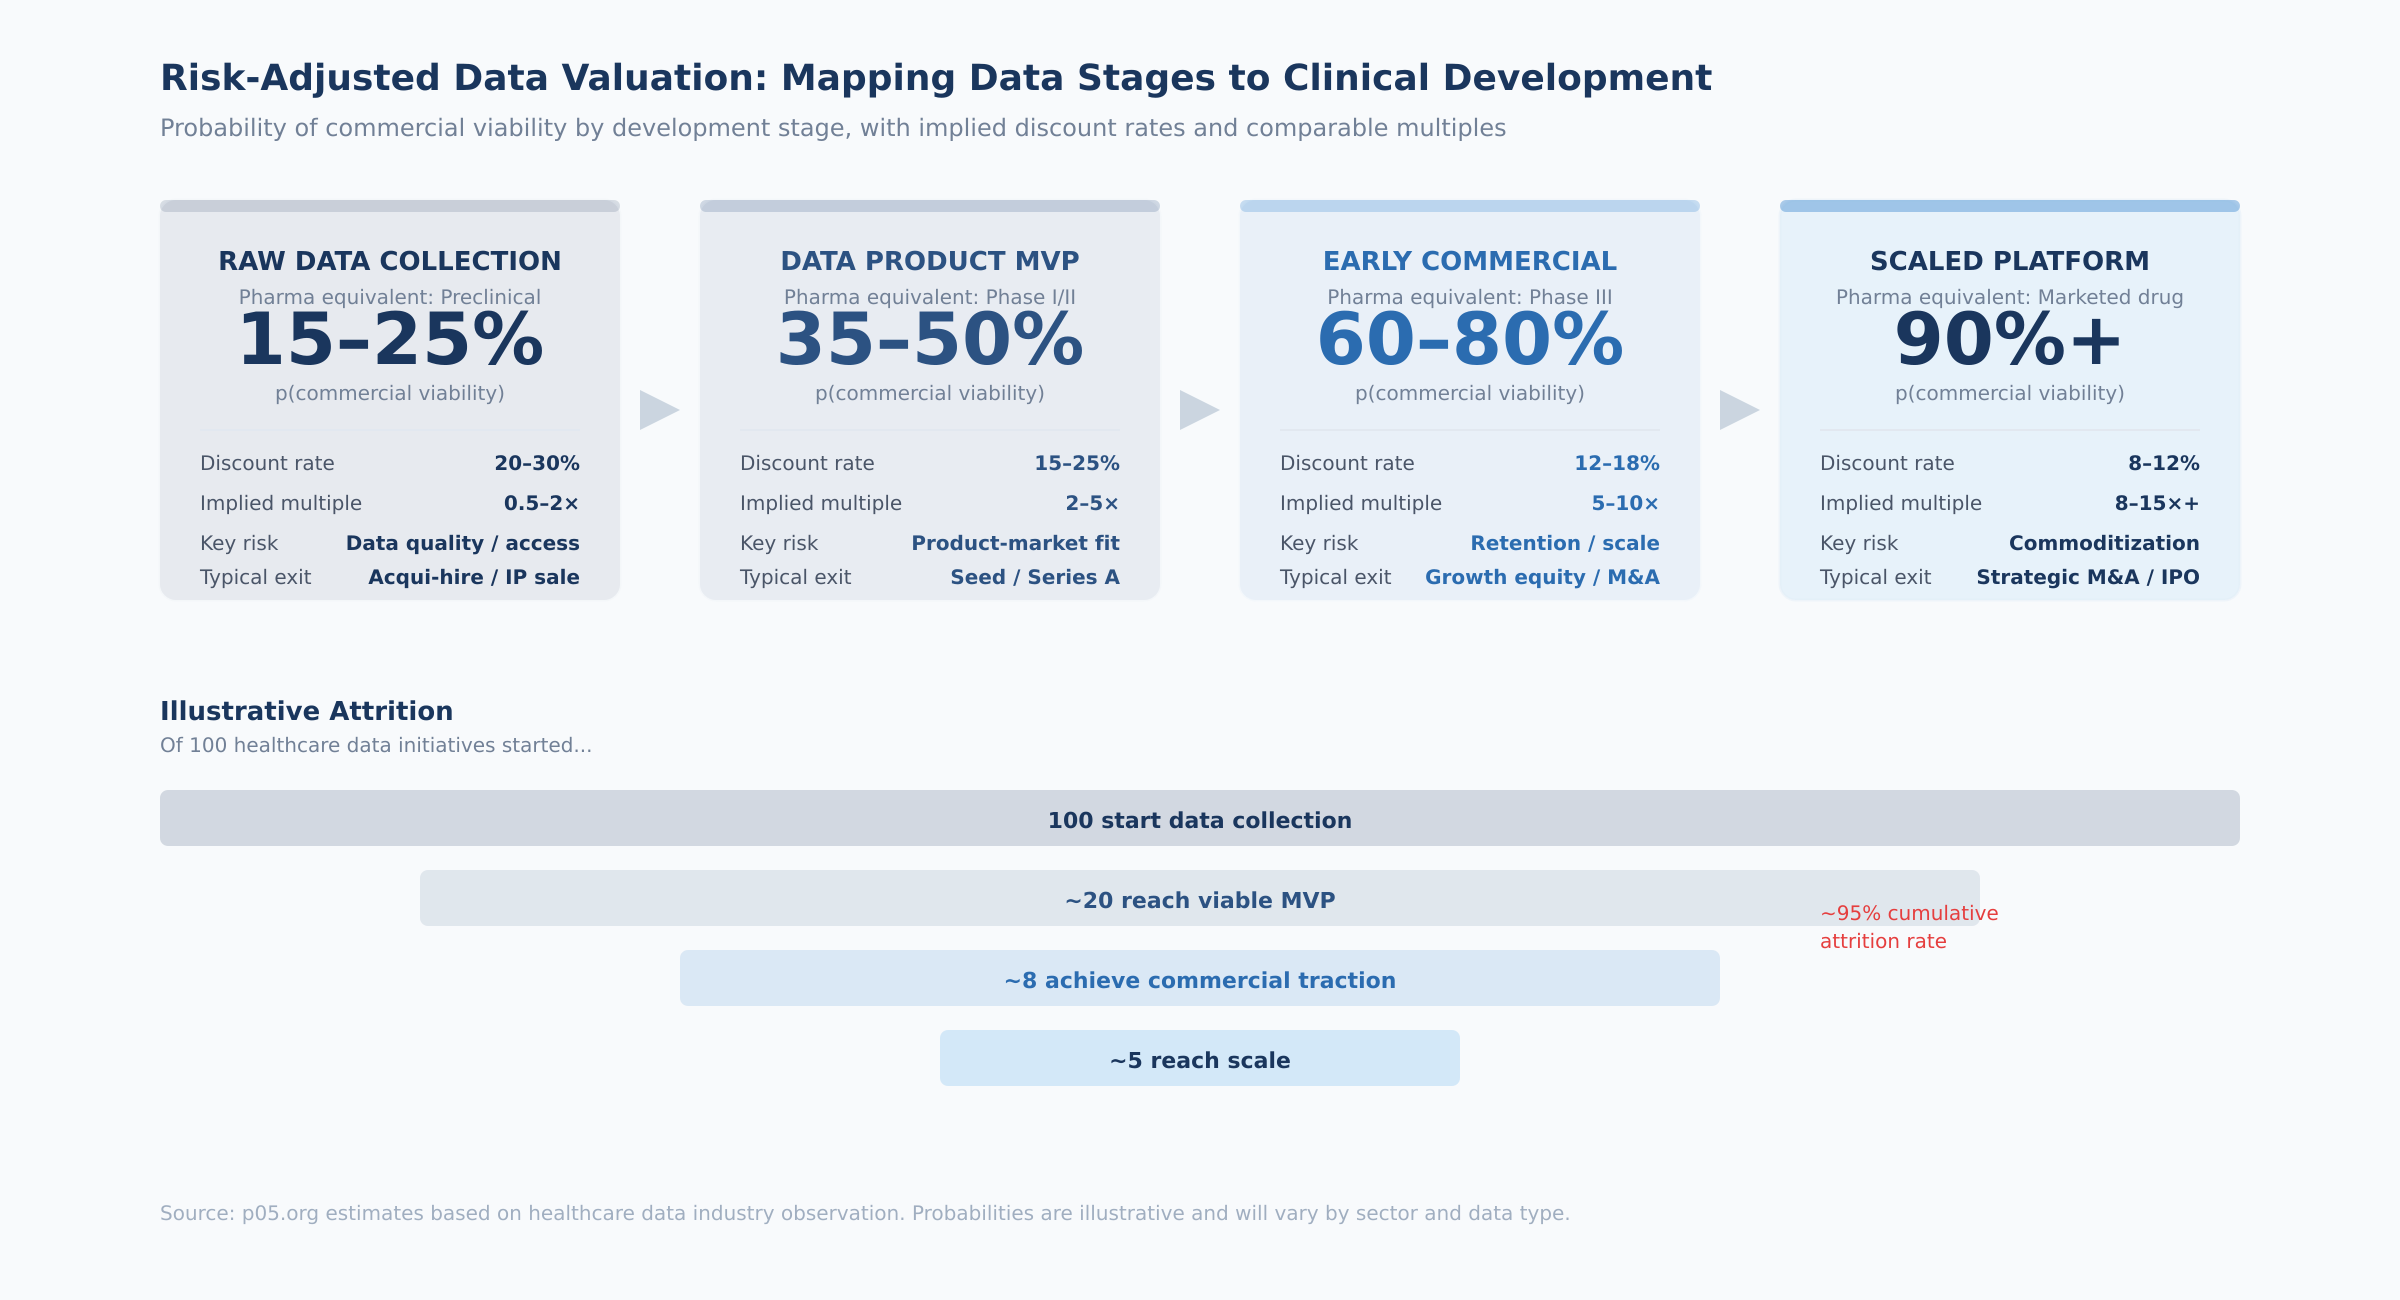
The four stages, with their probability ranges and practical indicators:
Raw data collection (analogous to preclinical). The question is whether the data can be gathered, cleaned, and structured in a commercially useful form. At this stage, you are evaluating data access agreements, collection feasibility, regulatory compliance, and data quality. The key diligence question: has anyone actually tried to build a product on this data, and what did they find? Probability of reaching the next stage: 15–25%.
Data product MVP (analogous to Phase I/II). A product exists and first paying customers have appeared, but product-market fit is uncertain. The indicators to evaluate: number of paying customers (not free trials), price point achieved versus cost of delivery, customer feedback on willingness to pay at scale, and whether any customer has integrated the data into a production workflow. The key diligence question: would these customers notice if the product disappeared tomorrow? Probability: 35–50%.
Early commercial (analogous to Phase III). The product has demonstrated market traction with growing ARR and multiple enterprise customers. At this point, the relevant metrics shift to retention (net revenue retention above 100% is the threshold), growth rate, customer concentration (top customer below 25% of revenue), and competitive positioning. The key diligence question: can a well-funded competitor replicate this dataset within two years? Probability: 60–80%.
Scaled platform (analogous to a marketed drug). Established revenue base, diversified customers, proven retention, embedded workflow integrations. The valuation shifts from probability-weighted scenarios to a more conventional DCF with lower discount rates. The key diligence question: what would it take to displace this product from its customers' workflows? Probability: 90%+.
How to assign a probability in practice. Start with the base rate for the stage (the ranges above), then adjust based on three factors: (1) the strength of the data moat — proprietary collection pushes probability up, easily replicated data pushes it down; (2) customer evidence — contracted multi-year revenue pushes up, pilot-stage or free usage pushes down; (3) competitive dynamics — sole-source data pushes up, commoditized category pushes down. Document your adjustments explicitly. The most common mistake is overconfidence — data founders almost always overestimate their probability of success, just as drug developers overestimate their probability of FDA approval.
Step 2: Project Revenue and Model the Cash Flow Stream
Revenue projection for data assets follows the same logic as for drug royalties, with one critical difference: you must model the cost of maintaining the asset, since data products require ongoing investment (unlike passive royalty streams).
For each year in the projection period (typically 5–7 years for data assets), estimate:
Gross revenue. For subscription-based data products, project customer count × average contract value × renewal rate. For usage-based models, project user base × average usage × price per unit. Growth should decelerate over the projection period — 30% in year 1 declining to 10–15% by year 5 is a reasonable trajectory for a growing data business.
Gross margin. Data businesses typically have gross margins of 60–85%, depending on the labor intensity of data collection and curation. A database that requires continuous manual abstraction (like Flatiron's oncology EHR data) will have lower margins than a platform that collects data programmatically (like claims aggregation). Model the margin expansion that typically accompanies scale.
Operating expenses. Unlike royalties, data assets require ongoing investment: engineering, data science, sales, compliance. Model these as a percentage of revenue that declines over time as operating leverage improves.
Free cash flow. Revenue minus COGS minus operating expenses minus capex. This is the cash flow stream you will discount.
Terminal value. For data assets with low-decay profiles and strong moats, a perpetuity growth model is appropriate: FCF in the terminal year ÷ (discount rate – long-term growth rate). For high-decay data, use a finite projection with no terminal value or a low terminal multiple. The terminal growth rate should reflect the long-term growth rate of the data's end market — for healthcare data, 3–5% is defensible given secular tailwinds from digitization and AI adoption.
Step 3: Select the Discount Rate
The discount rate for data assets sits on a spectrum between marketed pharmaceutical royalties (8–12%) and R&D-stage pharmaceutical assets (15–20%+):
| Data Asset Stage | Comparable Pharma Stage | Suggested Discount Rate |
|---|---|---|
| Scaled platform, diversified customers | Marketed drug royalty | 8–12% |
| Early commercial, growing ARR | Phase III asset | 12–18% |
| MVP with first paying customers | Phase I/II asset | 15–25% |
| Raw data, pre-product | Preclinical asset | 20–30% |
For healthcare data specifically, add 1–3 percentage points for regulatory risk (HIPAA, GDPR, EHDS compliance), data privacy evolution, and the illiquidity premium inherent in private data assets that lack a secondary trading market.
A practical shortcut. If you have comparable public companies, back into the implied discount rate from their current market multiples. For example, Tempus at 7× revenue with 83% growth implies a discount rate of roughly 15–18% depending on your terminal value assumptions. IQVIA's TAS segment, if valued standalone at 8–10× revenue, implies 10–14%. These market-implied rates serve as useful cross-checks for your bottom-up assumptions.
Step 4: Risk-Adjust and Calculate rNPV
The risk-adjusted NPV multiplies your DCF result by the probability of commercial viability assigned in Step 1:
rNPV = NPV of projected cash flows × p(commercial viability)
This is where the royalty framework earns its keep. A raw DCF of a data asset might yield an attractive valuation — but when you apply a 60% probability of sustained commercial success (for an early-commercial asset), the risk-adjusted value drops by 40%. This discipline prevents overpaying for data assets that have strong cash flows but uncertain staying power.
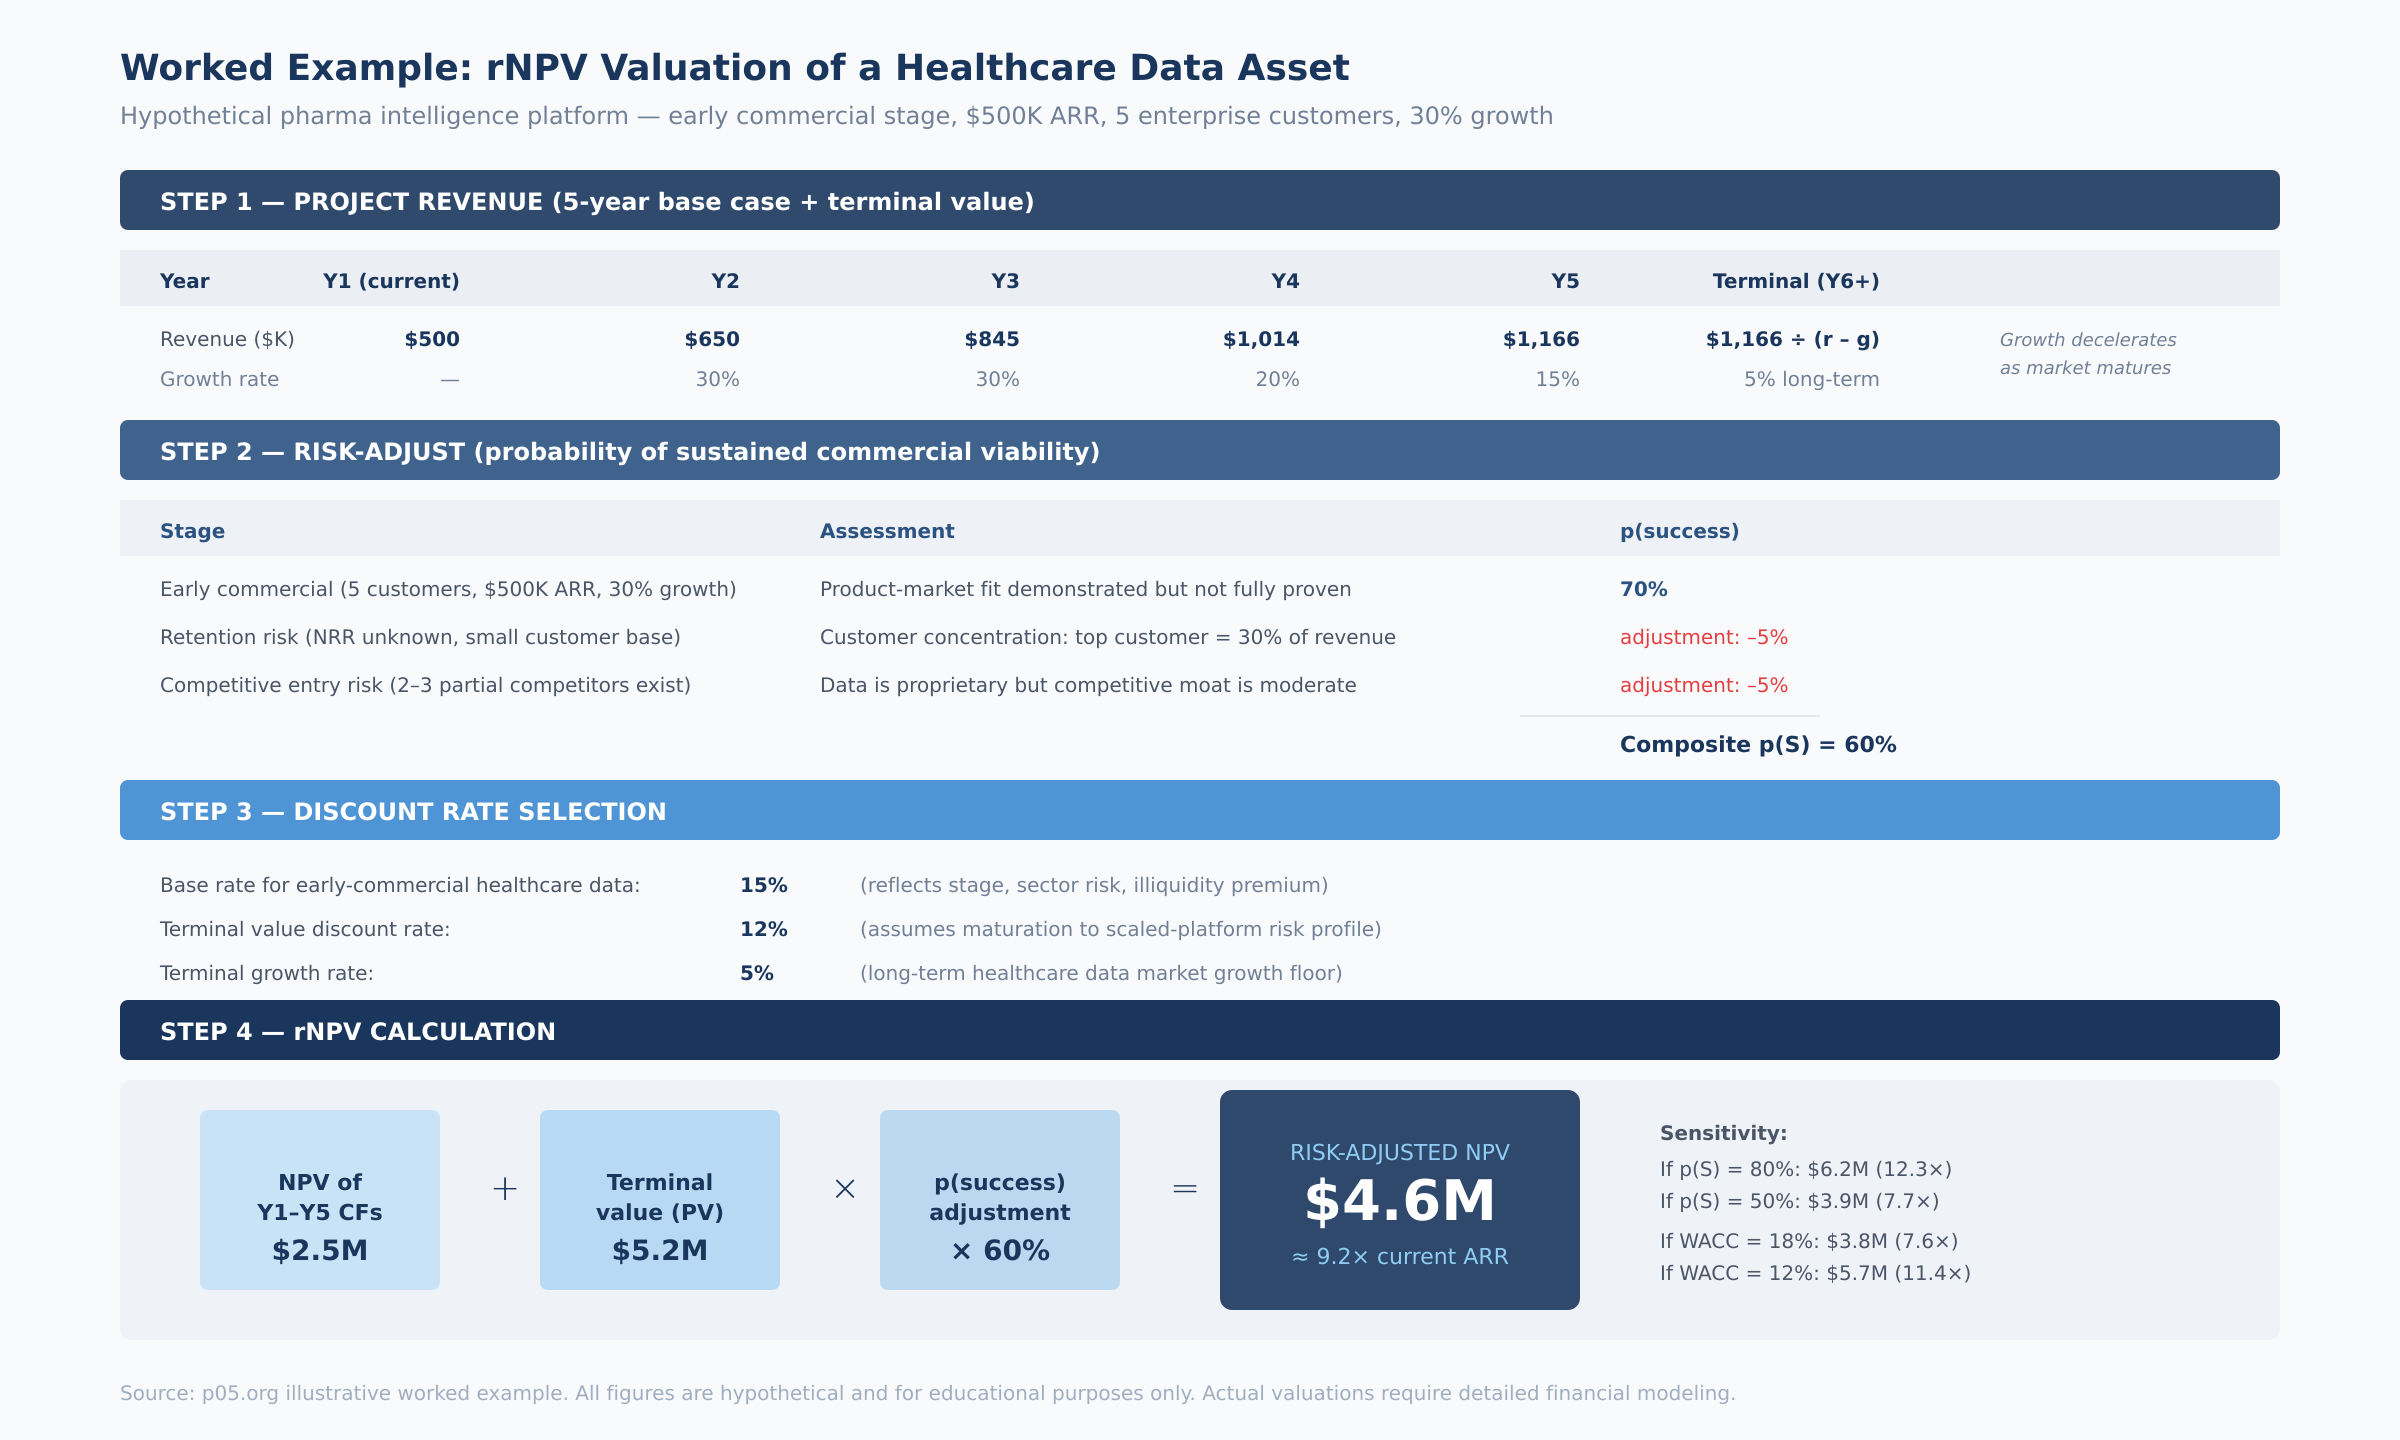
The worked example above illustrates the mechanics for a hypothetical pharmaceutical intelligence platform — an early-commercial asset with $500K ARR, five enterprise customers, and 30% growth. The probability-adjusted valuation lands at approximately 9× current ARR, with substantial sensitivity to both the probability assumption (range: 7.7× to 12.3× depending on p(S)) and the discount rate (range: 7.6× to 11.4× depending on WACC).
Sensitivity analysis is essential. Run scenarios across at least three dimensions: (1) probability of success (±15 percentage points from base case), (2) discount rate (±3 percentage points), and (3) terminal growth rate (0% to 5%). Present the results as a range, not a point estimate. The most honest thing you can say about any data asset's value is: "based on comparable transaction evidence and risk-adjusted cash flow analysis, the fair value range is $X to $Y, with the key swing factor being Z."
What the Deals Tell Us: 2024–2026 Transaction Evidence
The past eighteen months have produced a significant body of healthcare data M&A evidence. These transactions reveal what sophisticated buyers are actually willing to pay for data assets at various stages of maturity.
Thermo Fisher / Clario — $9.4 Billion (October 2025)
The largest full healthcare private equity exit of 2025. Thermo Fisher agreed to acquire Clario Holdings, a provider of endpoint data solutions for clinical trials, for $8.875 billion in cash at close plus up to $525 million in performance-based payments. Clario generated approximately $1.25–1.5 billion in revenue for 2025, implying a revenue multiple of roughly 6–7×.
Clario's technology integrates clinical trial endpoint data from devices, sites, and patients — it has supported approximately 70% of FDA drug approvals over the past decade. Under its PE owners (Nordic Capital, Astorg, Novo Holdings, Cinven), Clario doubled its revenue and expanded margins through organic growth and acquisitions including WCG's eCOA business and NeuroRx. William Blair described the deal as "a home run acquisition" for Thermo Fisher, complementing its PPD clinical research organization.
At 6–7× revenue, the Clario multiple sits in the range of marketed drug royalties (7–12× annual royalty streams). But this reflects the CRO-adjacent service component of the business. The pure data-and-analytics layer, if separated, would almost certainly command a premium.
IQVIA's Acquisition Spree — 2024–2025
IQVIA has been quietly assembling data infrastructure through a series of acquisitions. In December 2024, it acquired Point of Care Network, a provider of clinical decision-support tools. In May 2025, it acquired Whiz, an AI-based data analytics company. In October 2025, IQVIA agreed to acquire Cedar Gate Technologies for $750 million — a payer- and provider-focused data analytics business that opens a new market vertical for the company. And it quietly acquired Throtle, a healthcare identity-resolution company that connects fragmented data into unified audience profiles.
The Cedar Gate deal is particularly instructive. At $750 million, it represents IQVIA's push beyond pharmaceutical data into payer and provider analytics. As value-based care models expand, the data connecting clinical outcomes to financial performance becomes more valuable. Cedar Gate provides that connective tissue.
The Throtle acquisition reveals a different logic. Identity resolution — linking disparate data points into cohesive patient or provider profiles — is the infrastructure layer beneath data analytics. IQVIA already holds 1.2 billion unique de-identified patient records globally. Adding Throtle's identity graph strengthens the moat around that asset. The FTC previously blocked IQVIA's attempted acquisition of Propel Media (DeepIntent) in 2023–2024 on antitrust grounds, reflecting how seriously regulators view IQVIA's data dominance.
Tempus AI — Public Market Benchmark (IPO 2024, Ongoing)
Tempus provides the most current public-market reference point. Full-year 2025 revenue of approximately $1.27 billion, 83% year-over-year growth, 30% organic growth excluding Ambry Genetics. The Data & Applications segment generated approximately $316 million in revenue, growing at 31%. Tempus signed data deals with more than 70 clients in 2025 — Pfizer, Novartis, and Eli Lilly are integrating Tempus datasets into drug development programs. Net revenue retention of approximately 126%. Record total contract value exceeding $1.1 billion as of year-end 2025.
At $52 per share and a $9.2 billion market cap, Tempus trades at roughly 7× trailing revenue. The $200 million, three-year data license agreement with AstraZeneca and Pathos validates that curated clinical data commands premium pricing.
Norstella — Platform Consolidation (2022–2025)
Norstella represents the roll-up model applied to pharmaceutical intelligence data. Valued at approximately $5 billion following its 2022 merger with Citeline, it unites five brands: Citeline, Evaluate, MMIT, Panalgo, and The Dedham Group. In October 2024, it launched NorstellaLinQ — an integrated platform combining 74 billion data points across RWD, claims, EMR, lab results, and proprietary forecasting data.
NorstellaLinQ is significant because it represents the convergence strategy that all major pharma data companies are pursuing: integrate disparate data sources, apply AI for enrichment, and sell the combined product at a premium. The platform connects 500,000 investigators, tens of thousands of clinical trials, and tens of thousands of forecasts — the kind of comprehensive dataset that no single acquisition can replicate.
Other Notable Transactions — 2025
Qualtrics / Press Ganey Forsta ($6.8 billion, October 2025). Healthcare experience measurement built on proprietary survey and benchmarking data from hospitals. Embedded in quality measurement and reimbursement workflows.
Abbott / Exact Sciences ($23 billion, November 2025). At approximately 8× revenue, the deal reflects not just Cologuard testing revenue but the longitudinal patient data generated by millions of screening tests — valuable for population health analytics and drug development.
Duration and Decay: Classifying Your Data Asset
One of the most important — and most overlooked — steps in valuing data is classifying its decay profile. The decay rate directly determines the projection period in your DCF and the magnitude of the terminal value.
How to classify your data in practice. Ask three questions:
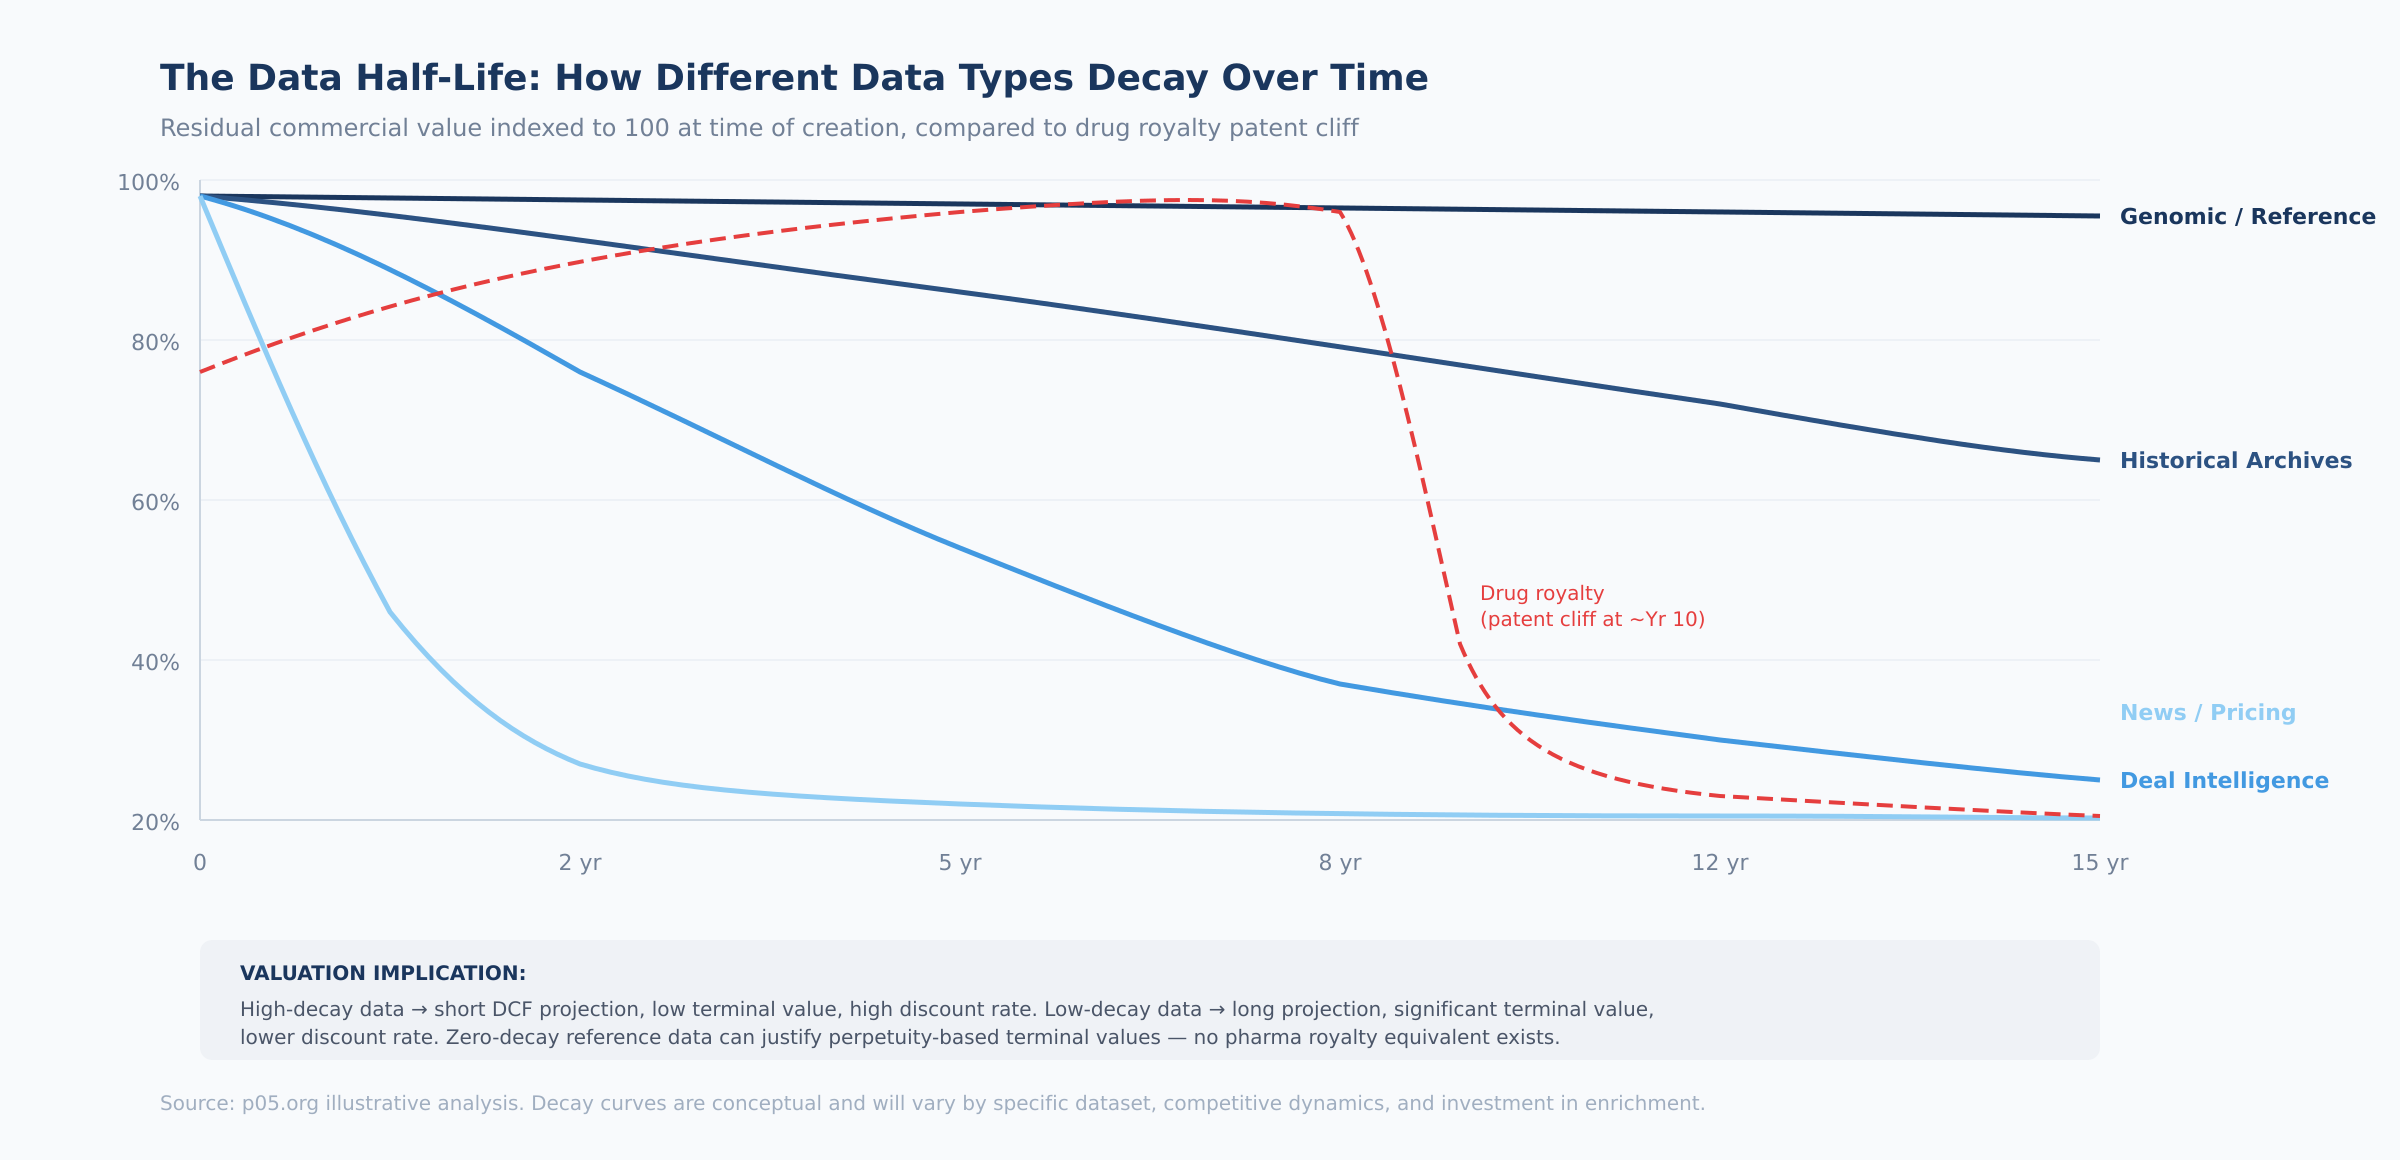
1. How quickly does the data lose predictive value? Real-time pricing data loses value in hours. Historical deal databases lose predictive value over years as market dynamics shift. Genomic reference data retains utility indefinitely. Map your data to the four decay categories: high (days–weeks), medium (1–5 years), low (10+ years), or zero (permanent).
2. How much investment is required to maintain value? High-decay data requires continuous collection and processing — this is an operating cost that must be modeled in the cash flow projection. Low-decay and zero-decay data requires minimal maintenance but may need periodic cleaning and format updates. The maintenance cost directly affects free cash flow margins.
3. What is the competitive refresh rate? Even if your data retains value, competitors may be building comparable datasets. The question is how fast. If a competitor can replicate your dataset within two years, your effective half-life is two years regardless of the data's inherent durability. If replication would take a decade (as with IQVIA's prescription data accumulation), the half-life is governed by the data's inherent properties, not competition.
Translating decay to DCF parameters:
| Decay Category | DCF Projection Period | Terminal Value Approach | Terminal Growth Rate |
|---|---|---|---|
| High-decay (days–weeks) | 1–3 years | No terminal value or low exit multiple | N/A |
| Medium-decay (1–5 years) | 5–7 years | Exit multiple (3–6× FCF) | 0–3% |
| Low-decay (10+ years) | 7–10 years | Perpetuity growth model | 3–5% |
| Zero-decay (permanent) | 10+ years | Perpetuity growth model | 2–5% |
The implication: a genomic reference database and a real-time pricing feed may generate identical current revenue, but the genomic database is worth substantially more because its terminal value — the present value of all cash flows beyond the explicit projection period — is much larger. In royalty terms, this is the difference between a royalty on a chronic-use drug with fifteen years of patent life and a royalty on a drug facing imminent LOE.
Defensibility: Scoring Your Data Moat
In royalty finance, defensibility comes from patents, regulatory exclusivity, and FDA approval barriers. In data, moats are more nuanced. The following framework scores five dimensions of data defensibility, each on a 1–5 scale:
Proprietary collection (weight: 25%) — the composition of matter patent equivalent. Can anyone else obtain this data? Score 5 if the data requires exclusive partnerships, proprietary hardware, or decade-plus accumulation. Score 1 if the data is publicly available or easily scraped. IQVIA scores 5 (decades of prescription data accumulation). A web-scraped clinical trial database scores 1–2.
Network effects (weight: 20%) — the label expansion equivalent. Does more usage make the product better? Score 5 if each additional customer or data point improves the product for all users (Tempus: each patient profiled strengthens AI models). Score 1 if the product is the same regardless of user count.
Switching costs (weight: 20%) — the standard-of-care equivalent. How painful is it for a customer to leave? Score 5 if the data is integrated via APIs into production workflows, compensation models, and regulatory reporting. Score 1 if customers can export data and switch providers in a week.
Regulatory moat (weight: 15%) — the exclusivity period equivalent. Do regulations create barriers to competitive entry? Score 5 if compliance requirements (HIPAA, IRB approvals, GDPR consent frameworks) took years to build and competitors must replicate. Score 1 if no regulatory barriers exist.
Data refresh investment (weight: 20%) — the lifecycle management equivalent. Does ongoing investment create a compounding advantage? Score 5 if continuous enrichment creates a data asset that grows in value faster than competitors can replicate. Score 1 if the data is static and competitors can catch up by buying historical archives.
Composite score interpretation:
| Score Range | Moat Assessment | Valuation Implication |
|---|---|---|
| 1.0–2.0 | Weak moat — data is replicable within 1–2 years | Discount multiple by 30–50% vs. category average |
| 2.0–3.0 | Moderate moat — some barriers but vulnerable | Apply category average multiples |
| 3.0–4.0 | Strong moat — replication would take 3–5+ years | Premium of 20–50% over category average |
| 4.0–5.0 | Dominant moat — effectively irreplaceable | Premium multiples; strategic acquirer willing to pay 2×+ category average |
A Practical Scoring Model: Putting It All Together
Combining the revenue assessment, risk-adjustment, decay classification, and defensibility scoring yields a composite data asset valuation score:
| Factor | Weight | Score 1 (Low) | Score 5 (High) |
|---|---|---|---|
| Revenue predictability | 20% | Ad hoc licensing, project-based | Multi-year enterprise contracts, >100% NRR |
| Data uniqueness | 25% | Publicly available or easily replicated | Proprietary, no alternative source |
| Refresh rate / half-life | 15% | Static, never updated | Continuously enriched, real-time feeds |
| Customer concentration | 10% | Single customer >50% of revenue | Diversified, no customer >15% |
| Switching costs / embeddedness | 15% | Easy to replace, no integrations | API-embedded in customer workflows |
| Market size / TAM | 15% | Niche (<$100M addressable) | Large, growing market (>$1B) |
Implied multiples by composite score:
| Composite Score | Implied Revenue Multiple | Comparable Context |
|---|---|---|
| 1.0–2.0 | 2–4× | Early-stage data, limited moat |
| 2.0–3.0 | 4–8× | Growing data product, some defensibility |
| 3.0–4.0 | 8–14× | Scaled platform, strong moat |
| 4.0–5.0 | 14–20×+ | Dominant platform, deep moat, compounding network effects |
Applying the model: IQVIA's Technology & Analytics Solutions segment scores 4.0–4.5 — multi-year enterprise contracts, genuinely proprietary data, continuously refreshed, deeply embedded in workflows, multi-billion-dollar TAM. The implied standalone multiple of 10–15× on TAS segment revenue suggests the current blended public market multiple significantly undervalues the data business.
Tempus scores 3.0–4.0, with the Data & Applications segment at the higher end given proprietary clinicogenomic data and 126% NRR, moderated by customer concentration risk and relative youth.
A curated pharmaceutical deal database with 2,000+ transactions, early enterprise customers, and AI-driven valuation capabilities but limited network effects and a smaller addressable market might score 2.5–3.5, implying 5–12×.
Where the Analogy Has Limits
Intellectual honesty matters. Several limitations deserve acknowledgment.
Drug royalties have contractually defined cash flows: the royalty rate, the product, and the payment mechanics are specified in enforceable legal agreements. Data revenue depends on customer renewal decisions, usage levels, and willingness to pay — introducing uncertainty that no analytical framework can fully eliminate.
Regulatory frameworks for IP valuation are mature. Courts have extensive experience adjudicating patent disputes. Data valuation standards are nascent — there is no equivalent of patent life remaining for a proprietary database, and legal protections for data assets (trade secret, database rights in the EU, contractual restrictions) are less robust than patent protection.
Drug royalties are passive income: the investor has no operational responsibility. Data products require ongoing investment. This operating cost means data asset valuations must account for maintenance investment, whereas royalty valuations need not.
And liquidity remains a fundamental gap. Pharmaceutical royalty streams trade in a well-established secondary market with active buyers and price discovery. No equivalent exists for data assets. When a healthcare data platform trades, the transaction is bespoke. This illiquidity premium should be reflected in higher required returns, partially offsetting data's structural advantages.
But these limitations are counterbalanced by data's structural strengths: no patent cliffs, near-zero marginal cost of serving additional customers, and network effects that create compounding value over time. The M&A evidence increasingly supports the conclusion that data assets with strong moats should command higher revenue multiples than equivalent royalty streams.
What the Selloff Gets Wrong — and Right
The current correction in healthcare data stocks reflects real concerns: higher interest rates pressure leveraged acquirers like IQVIA; CRO cyclicality creates earnings volatility; sector rotation reduces passive fund inflows.
These are legitimate reasons for multiple compression. But they are financial and macroeconomic — they do not reflect deterioration in the underlying data assets. IQVIA's Technology & Analytics Solutions segment continues to grow. Tempus's data licensing business is expanding with strong retention. Norstella is integrating its brands into a unified platform. The healthcare data market, projected to exceed $130 billion globally in 2026, is not shrinking.
For private market participants — acquirers, data licensors, companies evaluating their own data assets — the public market selloff creates a pricing dislocation. Private data transactions are not repriced daily. The $9.4 billion Thermo Fisher is paying for Clario, the $750 million IQVIA committed for Cedar Gate, the $6.8 billion Qualtrics is paying for Press Ganey — these were negotiated on strategic fundamentals, not on where IQVIA happens to trade on a given Tuesday in February.
The analytical tools to price data assets exist. They are the same tools that have priced pharmaceutical royalties for three decades: risk-adjusted cash flows, probability-weighted scenarios, comparable transactions, defensibility analysis, and duration modeling. The difference is that the data market is still developing the institutional infrastructure — the standardized instruments, the secondary market liquidity, the consensus valuation benchmarks — that makes the royalty market so efficient.
That infrastructure is being built. Each transaction adds comparable evidence. Each earnings report refines the benchmarks. The analytical gap between the two markets is closing.
The opportunity — and the risk — is that it has not closed yet.
All information in this article was accurate as of the research date and is derived from publicly available sources including company press releases, SEC filings, regulatory announcements, and financial news reporting. Information may have changed since publication. This content is for informational purposes only and does not constitute investment, legal, or financial advice. The author is not a lawyer or financial adviser. Always conduct your own due diligence and consult qualified professionals before making investment decisions.
Member discussion