What Pharma Royalty Financing Can Learn From Music, Mining, and Oil & Gas

When Blackstone closed a $1.47 billion asset-backed securitisation backed by royalties from 45,000 songs in November 2024, 25 institutional investors participated in a single rated issuance structured by MUFG, with Barclays, Goldman Sachs, Fifth Third Securities and SMBC Nikko as joint bookrunners.
The notes were rated A- by KBRA. Three months later, Concord closed an $850 million ABS — its third series under a broader $2.6 billion bond programme. By mid-2025, Recognition Music Group (Blackstone's rebranded Hipgnosis) was back with another $372 million issuance, and Concord followed with $1.8 billion more.
That same year, Royalty Pharma priced $2.0 billion in senior unsecured notes — $600 million due 2031 at 4.45%, $900 million due 2035 at 5.20%, and $500 million due 2055 at 5.95%. BofA, Goldman, J.P. Morgan, Morgan Stanley and TD Securities ran the books. The notes were rated Baa2 by Moody's (upgraded from Baa3 in April 2025). This brought Royalty Pharma's total outstanding debt to approximately $9.2 billion across six tranches, with a weighted average cost of roughly 3.75%.
Two markets. Comparable scale. Fundamentally different capital markets architecture. The music industry has built a full securitisation infrastructure — programmatic issuance, master trust structures, KBRA rating coverage, repeat institutional investor bases, and growing secondary market liquidity. The pharmaceutical royalty market has one company with investment-grade corporate bonds and a dormant ABS programme that last issued in 2018. Everything else is bilateral.
This article examines what other revenue-based financing markets have built that pharma has not yet adopted, and asks which instruments, structures, and market infrastructure could realistically migrate. The audience for this analysis understands how royalty transactions work. The question is why the structural toolkit remains so narrow — and what it would take to expand it.
The Valuation Gap: Why the Same Asset Class Gets Priced So Differently
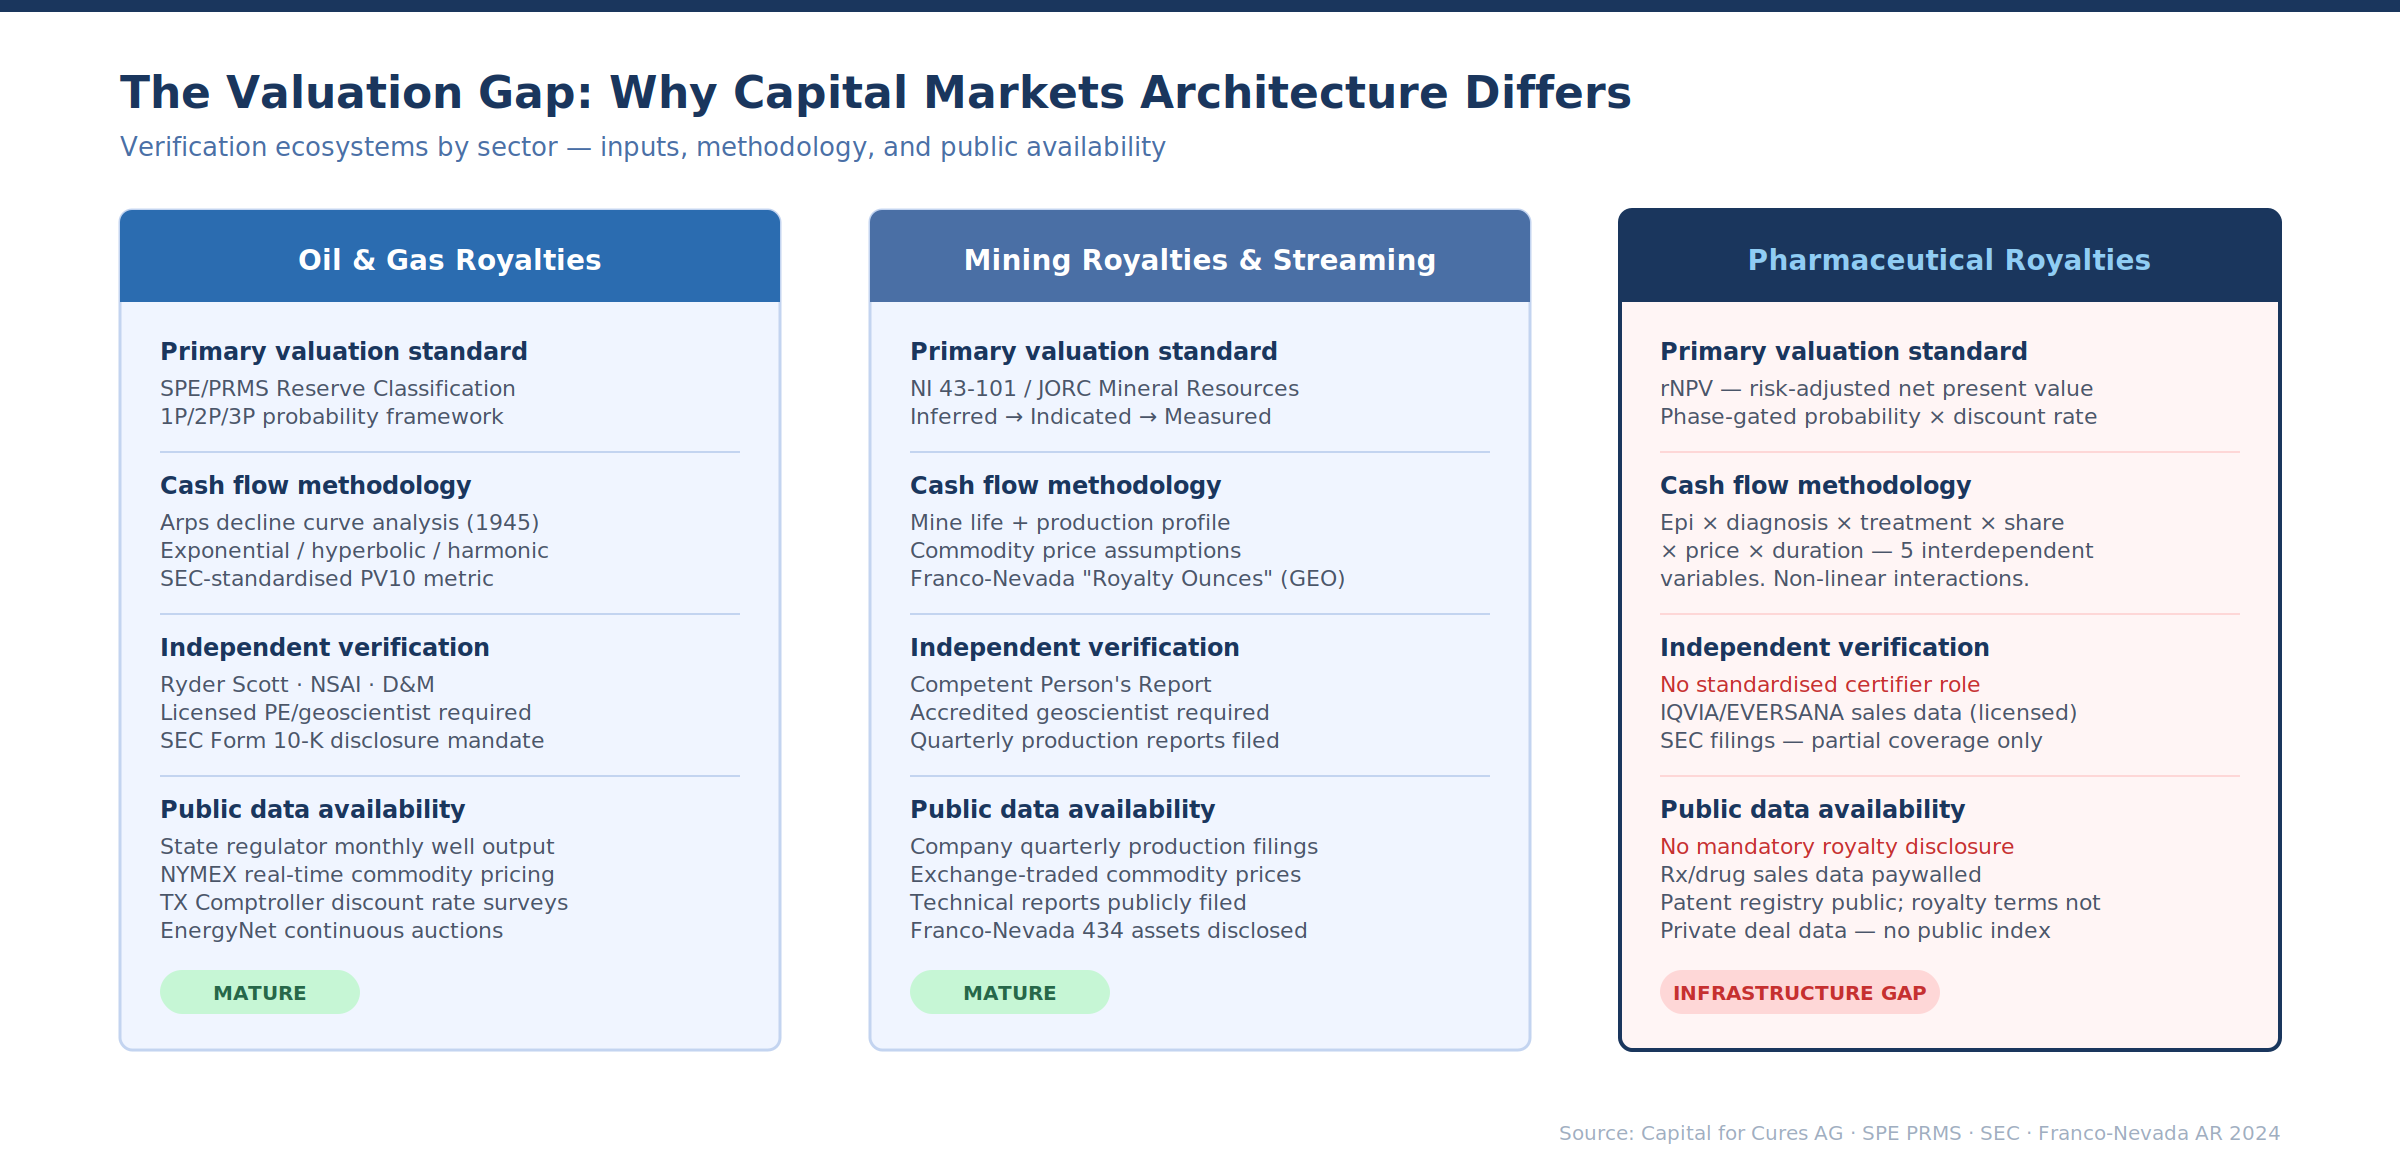
Before comparing instruments, it is worth understanding why the capital markets architecture differs so dramatically. The answer lies not primarily in legal structures or origination volume, but in valuation methodology — specifically, in how each sector answers the question: what will this revenue stream be worth?
Oil and gas royalty valuation rests on a framework that has been standardised over 80 years. The foundation is the reserve report: an independent third-party assessment of recoverable hydrocarbons, classified under the SPE/WPC Petroleum Resources Management System (PRMS) into Proved (1P, ≥90% probability), Proved + Probable (2P, ≥50%), and Proved + Probable + Possible (3P, ≥10%).
The SEC mandates that publicly traded companies disclose proved reserves annually in Form 10-K filings, with volumes assessed by specialist independent engineers — firms like Netherland, Sewell & Associates, DeGolyer and MacNaughton, or Ryder Scott — whose methodologies and reputations provide a trusted verification layer. Reserve classification creates a shared vocabulary of risk. When a buyer evaluates a royalty on Proved Developed Producing (PDP) reserves, both sides agree on what that means: wells that are open and producing today, under existing economic conditions.
PDP is the lowest-risk category. Proved Developed Non-Producing (PDNP) adds shut-in wells. Proved Undeveloped (PUD) adds undrilled locations requiring capital expenditure. Each category carries a different risk premium, and the market prices accordingly.
The cash flows from these reserves are then forecast using decline curve analysis, a methodology formalised by J.J. Arps in 1945 that models production decline as exponential, hyperbolic, or harmonic functions.
An Arps decline curve takes historical production data — monthly volumes from each well, reported to state regulators and publicly accessible — and extrapolates future production using three parameters: initial decline rate, the b-factor (which determines how quickly the decline rate itself declines), and limiting decline rate. The mathematics are elegant and empirically validated across millions of wells over eight decades.
They are not perfect — unconventional shale wells with high initial decline rates and extended hyperbolic tails have challenged classical models — but they provide a baseline that both buyer and seller can verify independently.
The output feeds into the PV10 calculation: the present value of estimated future net revenues (revenues minus direct operating expenses), discounted at the SEC-mandated flat rate of 10%. PV10 is an imperfect measure — it uses 12-month historical average pricing rather than forward curves, flat operating costs rather than inflation-adjusted projections, and a universal 10% discount rate regardless of risk profile — but its standardisation enables direct comparison across companies and assets. Everyone calculates PV10 the same way. This comparability is the entire point.
Fair market value (FMV) analyses go further, incorporating NYMEX futures curves for pricing, inflation-adjusted operating costs, after-tax cash flows, and risk-adjusted discount rates that reflect the specific asset's risk profile. The Texas Comptroller's property tax division publishes annual surveys of market-derived discount rates for oil and gas properties — providing a transparent, observable benchmark.
For Proved Developed Producing reserves, discount rates typically range from 12–18%; for undeveloped reserves, 17–25% or higher. But critically, these are continuous variables applied to continuous production curves. The underlying physics — reservoir pressure depletion driving production decline — is well understood and monotonic. Production goes down over time. The question is how fast, not whether.
Mining royalty valuation follows a parallel but distinct framework. Franco-Nevada converts its diverse portfolio into "Royalty Ounces" — a standardised gold-equivalent unit that enables cross-asset comparison. A 2% NSR royalty on a gold property yields 2% of stated Mineral Resources and Reserves as Royalty Ounces. Streams, NPIs, and non-gold assets get converted using specified commodity price assumptions ($2,800/oz gold, $31/oz silver, $4.25/lb copper as of their latest reporting).
This creates comparability across an otherwise heterogeneous portfolio spanning 434 assets. The key valuation inputs for a mining royalty are: mine life (based on Mineral Reserves under JORC or NI 43-101 standards), production profile (ramp-up, steady-state, decline), commodity price assumptions, and the royalty or stream terms themselves. The independent geological assessment — the Competent Person's Report or Technical Report — plays the same standardisation role as the petroleum reserve report.
The critical shared feature across oil, gas, and mining royalty valuation is this: the underlying physical resource is finite, measurable, independently verifiable, and declining. A reservoir depletes. A mine exhausts its ore body. Production curves slope downward.
The uncertainty is in the rate and economics of extraction, not in the fundamental physics. And the data is rich, continuous, and — importantly — publicly available. U.S. state regulators publish monthly well-level production data. Mining companies file quarterly production reports. Commodity prices trade on exchanges in real time. Any analyst can independently reconstruct a valuation from first principles.
How pharma royalty valuation is fundamentally different
Pharmaceutical royalty valuation inverts nearly every element of this framework. The industry standard is risk-adjusted net present value (rNPV), which applies cumulative probabilities of technical and regulatory success to forecast cash flows at each development stage. For a Phase 1 asset, the probability of reaching market approval is roughly 7–12% depending on therapeutic area.
For Phase 2, approximately 15–25%. For Phase 3 with positive data, 50–70%. The discount rate layers on top: surveys of biotech professionals report average discount rates of 40.1% for early-stage, 26.7% for mid-stage, and 19.5% for late-stage assets. By contrast, Royalty Pharma targets mid-teens unlevered IRRs on its overall portfolio and has achieved approximately 15% ROIC since 2019 — a number that reflects its focus on de-risked, commercial-stage royalties rather than early development.
The cash flow forecast itself is where the real divergence lies. In oil and gas, future production is modelled from physical depletion. In pharma, future revenue is modelled from epidemiology, market access, and competitive dynamics: patient population × diagnosis rate × treatment rate × market share × price per patient × duration on therapy. Each variable carries its own uncertainty distribution, and the interactions between them are non-linear.
A GLP-1 agonist's market share depends on payer formulary decisions that are renegotiated annually. A rare disease drug's revenue depends on patient identification rates that may improve with genetic testing adoption. An oncology asset's trajectory depends on whether a competitor's Phase 3 trial reads out positively or negatively — a binary event that can destroy 50% of projected revenue overnight.
This creates a fundamentally different shape of uncertainty. Oil and gas production follows smooth, monotonic decline curves with well-characterised uncertainty bands. Pharmaceutical revenues follow a launch-ramp-peak-cliff pattern: slow uptake in years 1–3, rapid growth to peak sales in years 4–8, a plateau, and then a cliff at loss of exclusivity (LOE) when generic or biosimilar competition enters.
The cliff is not a gentle decline — it can be a 70–90% revenue drop within 12–24 months. There is no analogue in oil and gas, where production declines gradually over decades. The patent cliff is more like a mine that collapses on a specific date that is known years in advance but whose exact economic impact is contested.
For commercial-stage royalties — the segment most relevant to securitisation and capital markets development — the valuation challenge is somewhat more tractable. A drug that has been on the market for 18–24 months is considered substantially de-risked. The sales trajectory is observable. The competitive landscape is known. The remaining uncertainties are: pricing pressure (especially from IRA negotiation in the U.S., where drugs with over $200 million in Part B spend or $500 million in Part D spend become eligible for CMS price negotiation 9–13 years post-approval), unexpected safety signals, biosimilar/generic entry timing, and indication expansion.
Approved royalties trade at 7–12x annual royalty streams, translating to buyer IRRs of 8–12% — a range that approaches oil and gas discount rates for proved reserves and suggests the market recognises that approved drug royalties are, structurally, not that different from producing mineral interests.
The verification ecosystem: what oil & gas actually built
The gap between oil & gas and pharma royalty markets is not just about valuation methodology. It is about the entire ecosystem of verification that sits around it — and that ecosystem took decades and hundreds of billions of dollars in transaction volume to construct.
In oil and gas, the independent reserve engineer occupies a structural role with no pharma equivalent. Firms like Ryder Scott, Netherland Sewell & Associates (NSAI), DeGolyer and MacNaughton, and Miller and Lents produce "Green Book" reserve reports — signed and stamped certifications that disclose reserves, future production profiles, and cash flows for a specific property.
These are not opinions; they are engineering assessments conducted under SPE standards that specify the qualifications of the evaluator (a Qualified Reserves Evaluator requires accreditation as a licensed professional engineer or geoscientist, plus typically 10–30 years of field experience), independence requirements (no financial interest in the property, compensation not contingent on estimates), data standards, and audit tolerance guidelines.
Ryder Scott's staff engineers must hold professional accreditation before becoming officers of the company. The SEC requires that reserve reports attached to Form 10-K filings be prepared or audited by qualified independent evaluators, and companies must disclose the qualifications and independence of those evaluators.
The verification chain runs deeper than the reserve engineer. U.S. state regulators — the Railroad Commission of Texas, the Oklahoma Corporation Commission, the North Dakota Industrial Commission — collect and publish monthly well-level production data. Any analyst can download historical production for every well in the Permian Basin, fit an Arps decline curve, and produce their own reserve estimate. Commodity prices are observable in real time on NYMEX.
Operating costs are disclosed in Form 10-K supplemental schedules. Lease operating expenses, severance taxes, and workover costs are reported by basin and by property type. The Texas Comptroller publishes annual surveys of market-derived discount rates used by appraisers valuing oil and gas properties for ad valorem tax purposes — a transparent, observable benchmark derived from actual transactions.
This creates a verification stack with multiple independent layers: the operator reports production data to the state, the state publishes it, the reserve engineer independently estimates reserves from that data, the SEC reviews the resulting Form 10-K disclosures, the rating agency (if ABS is involved) models the cash flows using the same public data, and any investor can cross-check using freely available well-level production records. At each layer, the methodology is standardised and the inputs are public.
The trust is distributed, not concentrated.
The transaction infrastructure builds on this. EnergyNet has 48,000+ registered buyers and runs continuous online auctions for mineral rights and royalty interests, from $1,000 packages to $250 million+ portfolios. Energy Domain, Oil & Gas Asset Clearinghouse, and Mid-Continent Energy Exchange provide additional marketplaces. As of January 2026, a new entrant — Oil-Royalties — launched a virtual auction marketplace with standardised data formats, consistent valuation inputs, and a proprietary "Max Bid Value" algorithm to help buyers establish bidding limits.
These platforms work because buyers can independently verify the underlying data: production histories are public, decline curves are reproducible, and PV10 provides a standardised (if imperfect) valuation anchor.
What pharma has — and what it lacks
The pharmaceutical industry does have nascent equivalents to some of these verification layers, but the coverage is uneven and the standardisation is immature.
For sales data, IQVIA (formerly IMS Health) has been the pharmaceutical industry's standard source for over 40 years, tracking weekly and monthly sales across 90+ categories of providers, sourcing from 550+ suppliers including nearly 100 manufacturers. Their National Prescription Audit covers approximately 93% of U.S. outpatient prescriptions.
This is analogous to the state-level production data in oil and gas — comprehensive, granular, and continuously updated. But unlike state production data, IQVIA data is proprietary and expensive. Access requires large budgets and multi-year contracts. It is not freely available to any analyst who wants to build a model.
For sales forecasts, EvaluatePharma (now part of Norstella) aggregates consensus forecasts from sell-side analysts, while Visible Alpha goes deeper — extracting drug-level forecasts directly from 250+ sell-side brokers' actual working spreadsheet models, normalising them into consensus views with an average of 161 line items per company.
Visible Alpha launched its dedicated BioPharma platform in February 2024, providing peak sales analysis, extended forecast horizons, and built-in auditability with time-stamped broker estimates. IQVIA's Forecast Link offers 10-year sales value and volume forecasts for 10,000 drugs across 600 diseases and 75 countries. These services function as the pharmaceutical equivalent of the reserve engineer — expert, independent estimates of future cash flows. But there are critical differences.
Consensus forecasts aggregate opinion; reserve reports aggregate physical measurement. A reserve engineer's estimate is bounded by the laws of thermodynamics and the observed pressure-volume-temperature behaviour of the reservoir. A pharmaceutical sales forecast is bounded by analyst judgment about patient uptake curves, pricing assumptions, and competitive dynamics — inputs where reasonable people routinely disagree by a factor of two or more.
For deal pricing benchmarks, there is no pharma equivalent of the Texas Comptroller's discount rate surveys. Royalty deal terms are disclosed in SEC filings when public companies are involved, but the implied IRRs, discount rates, and valuation multiples must be reverse-engineered from disclosed cash flows and upfront payments.
There is no central repository of pharma royalty transaction pricing, no standardised reporting of implied returns, and no observable index of royalty yields. Royalty Pharma discloses that it targets mid-teens unlevered IRRs and reports 15% ROIC, but this is one data point from the market's dominant player — not a distributed, observable benchmark.
The absence of pricing transparency is both a cause and a consequence of the bilateral market structure: without transparency, there is no liquid market, and without a liquid market, there is no mechanism to generate transparent pricing.
For independent verification, no firm occupies the structural role of the reserve engineer in pharmaceutical royalty transactions. When DRI Capital structured its ABS programme, the indenture required third-party sales consultants to provide periodic cash flow forecasts and verify that royalty payments remained within 15% of projections — a clever adaptation that borrowed directly from ABS servicing practices. But this was a deal-specific requirement, not an industry-wide institution.
There is no SPE-equivalent professional body for pharmaceutical royalty evaluators, no standardised qualification framework, no audit standards, and no obligation for independent third-party certification in bilateral transactions. The DRI structure proved it could work; nobody replicated it at scale.
Is the analogy actionable, or too sector-specific?
The honest assessment is that some of the oil & gas verification infrastructure is transferable, but the analogy has hard limits — and understanding where it breaks down is more useful than pretending it doesn't.
What transfers directly:
The concept of standardised third-party cash flow certification is immediately applicable to pharma royalty ABS and could be a requirement for any rated issuance. The DRI model — third-party sales consultant providing periodic forecasts with variance triggers — should be the baseline, not the exception. Rating agencies already insist on this for music ABS (Hipgnosis's KBRA-rated issuance included revenue projection stress testing); there is no structural reason it cannot become standard for pharma.
The firms to provide it already exist: IQVIA, EvaluatePharma, and the specialist healthcare consultancies (Alacrita, L.E.K., McKinsey's pharma practice) have the expertise. What is missing is the formalisation — the equivalent of SPE audit standards that define what "independent pharmaceutical royalty cash flow certification" means, who is qualified to provide it, and what independence requirements apply.
The concept of public, standardised data infrastructure is partially transferable. Quarterly royalty receipts by product, geography, and royalty rate — disclosed in a consistent format — would give pharmaceutical royalty markets the equivalent of state-level production data. Royalty Pharma's Form 10-K already provides this for its portfolio. If a pharma royalty ETF or multi-issuer ABS programme emerged, standardised trustee reporting in a consistent machine-readable format would be essential and achievable. It does not require new science, only new convention.
The concept of marketplace platforms is transferable. EnergyNet proves that royalty interests with values ranging from $1,000 to $250 million can transact on a single platform with standardised due diligence packages and competitive bidding — if the verification infrastructure supports independent buyer diligence.
A pharmaceutical royalty marketplace would require standardised data packages (product, territory, royalty rate, remaining patent life, recent sales data, consensus forecasts) and accessible valuation tools. The barrier is not technology; it is the absence of public data that would allow buyers to form independent views.
Where the analogy breaks down:
The fundamental difference is that oil and gas reserves are physically measurable, monotonically declining, and governed by well-understood thermodynamics. You can core a well, measure permeability and porosity, run a pressure test, and model future production from first principles. Two engineers with the same well data will converge on similar estimates because the physics constrains the answer.
Pharmaceutical revenues are not governed by physics. They are governed by prescriber behaviour, payer decisions, competitor actions, regulatory changes, and patient adherence — all of which are reflexive (they change in response to each other) and subject to discontinuous shocks (a safety signal, a competitor approval, an IRA price negotiation). The variance between two analysts' peak sales estimates for the same drug is structurally wider than the variance between two engineers' EUR (estimated ultimate recovery) for the same well — and this variance is irreducible, not a problem of data quality or methodology.
This means that the reserve report model cannot be directly transplanted to pharma. A "Qualified Pharmaceutical Royalty Evaluator" certified by a professional body could provide independent cash flow estimates, but those estimates would carry fundamentally wider uncertainty bands than a petroleum reserve report. The evaluator's role would be closer to a sell-side equity analyst than a reserve engineer — informed opinion rather than bounded measurement.
This is not a criticism; it is a structural feature of the asset class. The question is whether that level of uncertainty is compatible with the standardisation required for liquid markets.
The answer, for commercial-stage royalties, is probably yes — with appropriate caveats. A drug that has been on the market for three years, with observable quarterly sales data, consensus coverage from 10+ sell-side analysts, a known competitive landscape, and a defined patent expiry date is more like a Proved Developed Producing reserve than like a Phase 2 clinical asset.
The cash flows are not certain, but they are reasonably forecastable within a range that supports ABS overcollateralisation ratios and debt service coverage tests. DRI Capital's nine issuances proved this empirically. The Trikafta/Alyftrek dispute between Royalty Pharma and Vertex — where the parties disagree on whether deuterated ivacaftor is the same compound as ivacaftor for royalty purposes, with the difference being approximately 4% vs. 8% blended royalty — illustrates a different kind of risk (contractual interpretation) but does not invalidate the underlying cash flow predictability.
The practical roadmap, then, is not "build the SPE for pharma" — that overstates the transferability. It is to build the layers that are transferable: standardised trustee reporting formats for royalty cash flows, a formalised role for independent cash flow consultants in rated transactions, accessible consensus forecast infrastructure (which Visible Alpha and IQVIA are already building), and transparent disclosure of deal pricing to enable market-derived benchmarks.
Each layer incrementally reduces the specialist knowledge advantage that keeps pharma royalties in bilateral markets — not by pretending the uncertainty is smaller than it is, but by making the uncertainty legible to a broader investor base.
The Instrument Landscape: A Taxonomy of What Pharma Is Missing
| Instrument | Music | Oil & Gas | Mining | Pharma |
|---|---|---|---|---|
| Rated ABS / securitisation | ✓ ($1.47B Hipgnosis, $1.8B Concord, programmatic) | ✓ (VPP securitisations since 1990s, Enron Cactus Funds) | Limited | Dormant (DRI Capital last issued 2018; $1.8B across 9 deals) |
| Master trust structure | ✓ (Concord $2.6B programme, Hipgnosis Lyra series) | ✓ (standard in production payment ABS) | ✗ | ✓ (DRI Drug Royalty III LP 1, but inactive) |
| Publicly traded royalty vehicles | ✓ (Hipgnosis Songs Fund — now privatised) | ✓ (Permian Basin, Sabine, Kimbell, PermRock, Dorchester) | ✓ (Franco-Nevada, Wheaton, Royal Gold — $60B+ combined mkt cap) | ✓ (RPRX, DHT.UN, XOMA, LGND — but operating companies, not passive trusts) |
| Streaming (physical delivery at discount) | ✗ | ✗ | ✓ ($15B+ market; Wheaton, Franco-Nevada) | ✗ |
| Volumetric production payments | ✗ | ✓ (with statutory bankruptcy safe harbour under §541(b)(4)(B)) | ✗ | ✗ |
| Net profits interests | ✗ | ✓ (carved from working interest, cost-bearing) | ✓ (carried interest structures) | ✗ |
| Overriding royalty interests (ORRIs) | ✗ | ✓ (standard non-operating interest, non-expense bearing) | ✓ (NSR royalties) | ✗ |
| Fractional / retail platforms | ✓ (SongVest Reg A+, Royalty Exchange auctions, JKBX) | ✓ (EnergyNet, mineral auctions) | Limited | ✗ |
| Royalty-focused ETFs | ✓ (MUSQ Global Music Industry ETF) | ✓ (via energy ETF inclusion) | ✓ (Betashares ROYL, VanEck GDX) | ✗ |
| Carbon/ESG royalty structures | ✗ | ✗ | ✓ (Green Star Royalties, Carbon Streaming Corp) | ✗ |
| Development funding bonds | ✗ | ✗ | ✗ | ✓ (RPRX/MorphoSys $300M, monetised for $511M at 5.35% discount rate) |
| Syndicated primary issuance | Rare (but ABS investor base provides equivalent) | Common (bank lending) | Common (project finance) | Rare (~8-9% of volume) |
Securitisation: What Actually Happened, What Stopped, and What Could Restart
The standard narrative — "pharma royalties haven't been securitised" — is wrong. They have. Between 2000 and 2018, at least four platforms completed over $2 billion in rated securities backed by pharmaceutical royalty cash flows. The correct statement is that pharma royalty securitisation started, proved the mechanics work, and then stalled.
The BioPharma Royalty Trust completed the first major deal in 2000: $115 million backed by Yale University's royalties on Zerit (stavudine), the HIV drug licensed to Bristol-Myers Squibb. The structure included $57 million in senior debt rated A by S&P, $22 million in mezzanine debt, and $22 million in equity. WestLB arranged. Yale received over $100 million upfront.
The deal became an immediate cautionary tale — Zerit sales declined sharply as newer HIV treatments emerged, triggering early amortisation and collection shortfalls. Single-asset, single-disease, single-patent. Everything that can go wrong did.
Royalty Pharma created what it described as "the first securitization debt facility backed by pharmaceutical royalties" in 2004 — a diversified pool rated Aaa by Moody's. In 2007, Royalty Pharma converted this facility to a syndicated term loan, achieving a lower blended cost of capital. By 2020, it had IPO'd on Nasdaq for $2.2 billion, and by September 2020 launched a $6 billion inaugural bond offering across six tranches.
The trajectory tells the story: securitisation facility → syndicated term loan → public equity → unsecured investment-grade corporate bonds. Each step lowered the cost of capital and broadened the investor base. Securitisation was not the destination; it was the on-ramp.
Paul Capital's Royalty Securitization Trust achieved Aaa from Moody's through a diversified pool spanning pharma, biotech, medical device, and diagnostic royalties within a $1 billion-plus platform across two healthcare royalty funds.
DRI Capital became the most prolific issuer, completing nine securitisation transactions since 2005 totalling over $1.8 billion in debt securities. Their structures offer the clearest window into what pharma royalty ABS actually looks like. The Series 2014-1 was $450 million in two tranches rated BBB by S&P, backed by 31 royalty streams on 14 drugs (Stelara, Simponi, Tysabri) with 36.2% overcollateralisation. The Series 2017-1 was $150 million with an A1FCF tranche at 4.94% (rated AAA by KBRA and Fitch) and a B1 tranche at 6.78%, with Keytruda at 35.8%, Odefsey at 17.1%, and Eylea at 14.5% of pool value.
Goldman Sachs was structuring agent and bookrunner across these deals. The Series 2018-1 added $100 million rated BBB by both S&P and KBRA, with 52% overcollateralisation. All three series were issued from the same Drug Royalty III LP 1 master trust — the same structure Concord Music now uses for its $2.6 billion ABS programme.
The mechanics worked. The cash waterfall architecture — trustee fees → interest → reserve replenishment (minimum six months) → DSCR maintenance (2:1) → LTV adjustment → principal → excess spread — functioned as designed. The credit enhancement worked: overcollateralisation of 36–52%, reserve accounts funded at closing, debt service coverage ratios with early amortisation triggers, and forward-looking cash flow tests with third-party sales consultants ensuring royalty payments remained within 15% of forecasts.
Then it stopped. DRI has not issued since 2018. No new entrant has launched a pharma royalty ABS programme. The market went dormant.
Why securitisation stalled in pharma while scaling in music
The comparison with music is instructive because it is so unflattering for pharma. Music royalty ABS had its own early stumbles — Bowie Bonds in 1997 were eventually downgraded to junk after Napster destroyed CD revenue predictability. But the market rebuilt. Hipgnosis issued a $222 million ABS in 2022, scaled to $1.47 billion in 2024, and Blackstone (through Recognition Music) kept issuing in 2025. Concord built a multi-series programme across $4.9 billion in cumulative issuance. Kobalt raised $266.5 million.
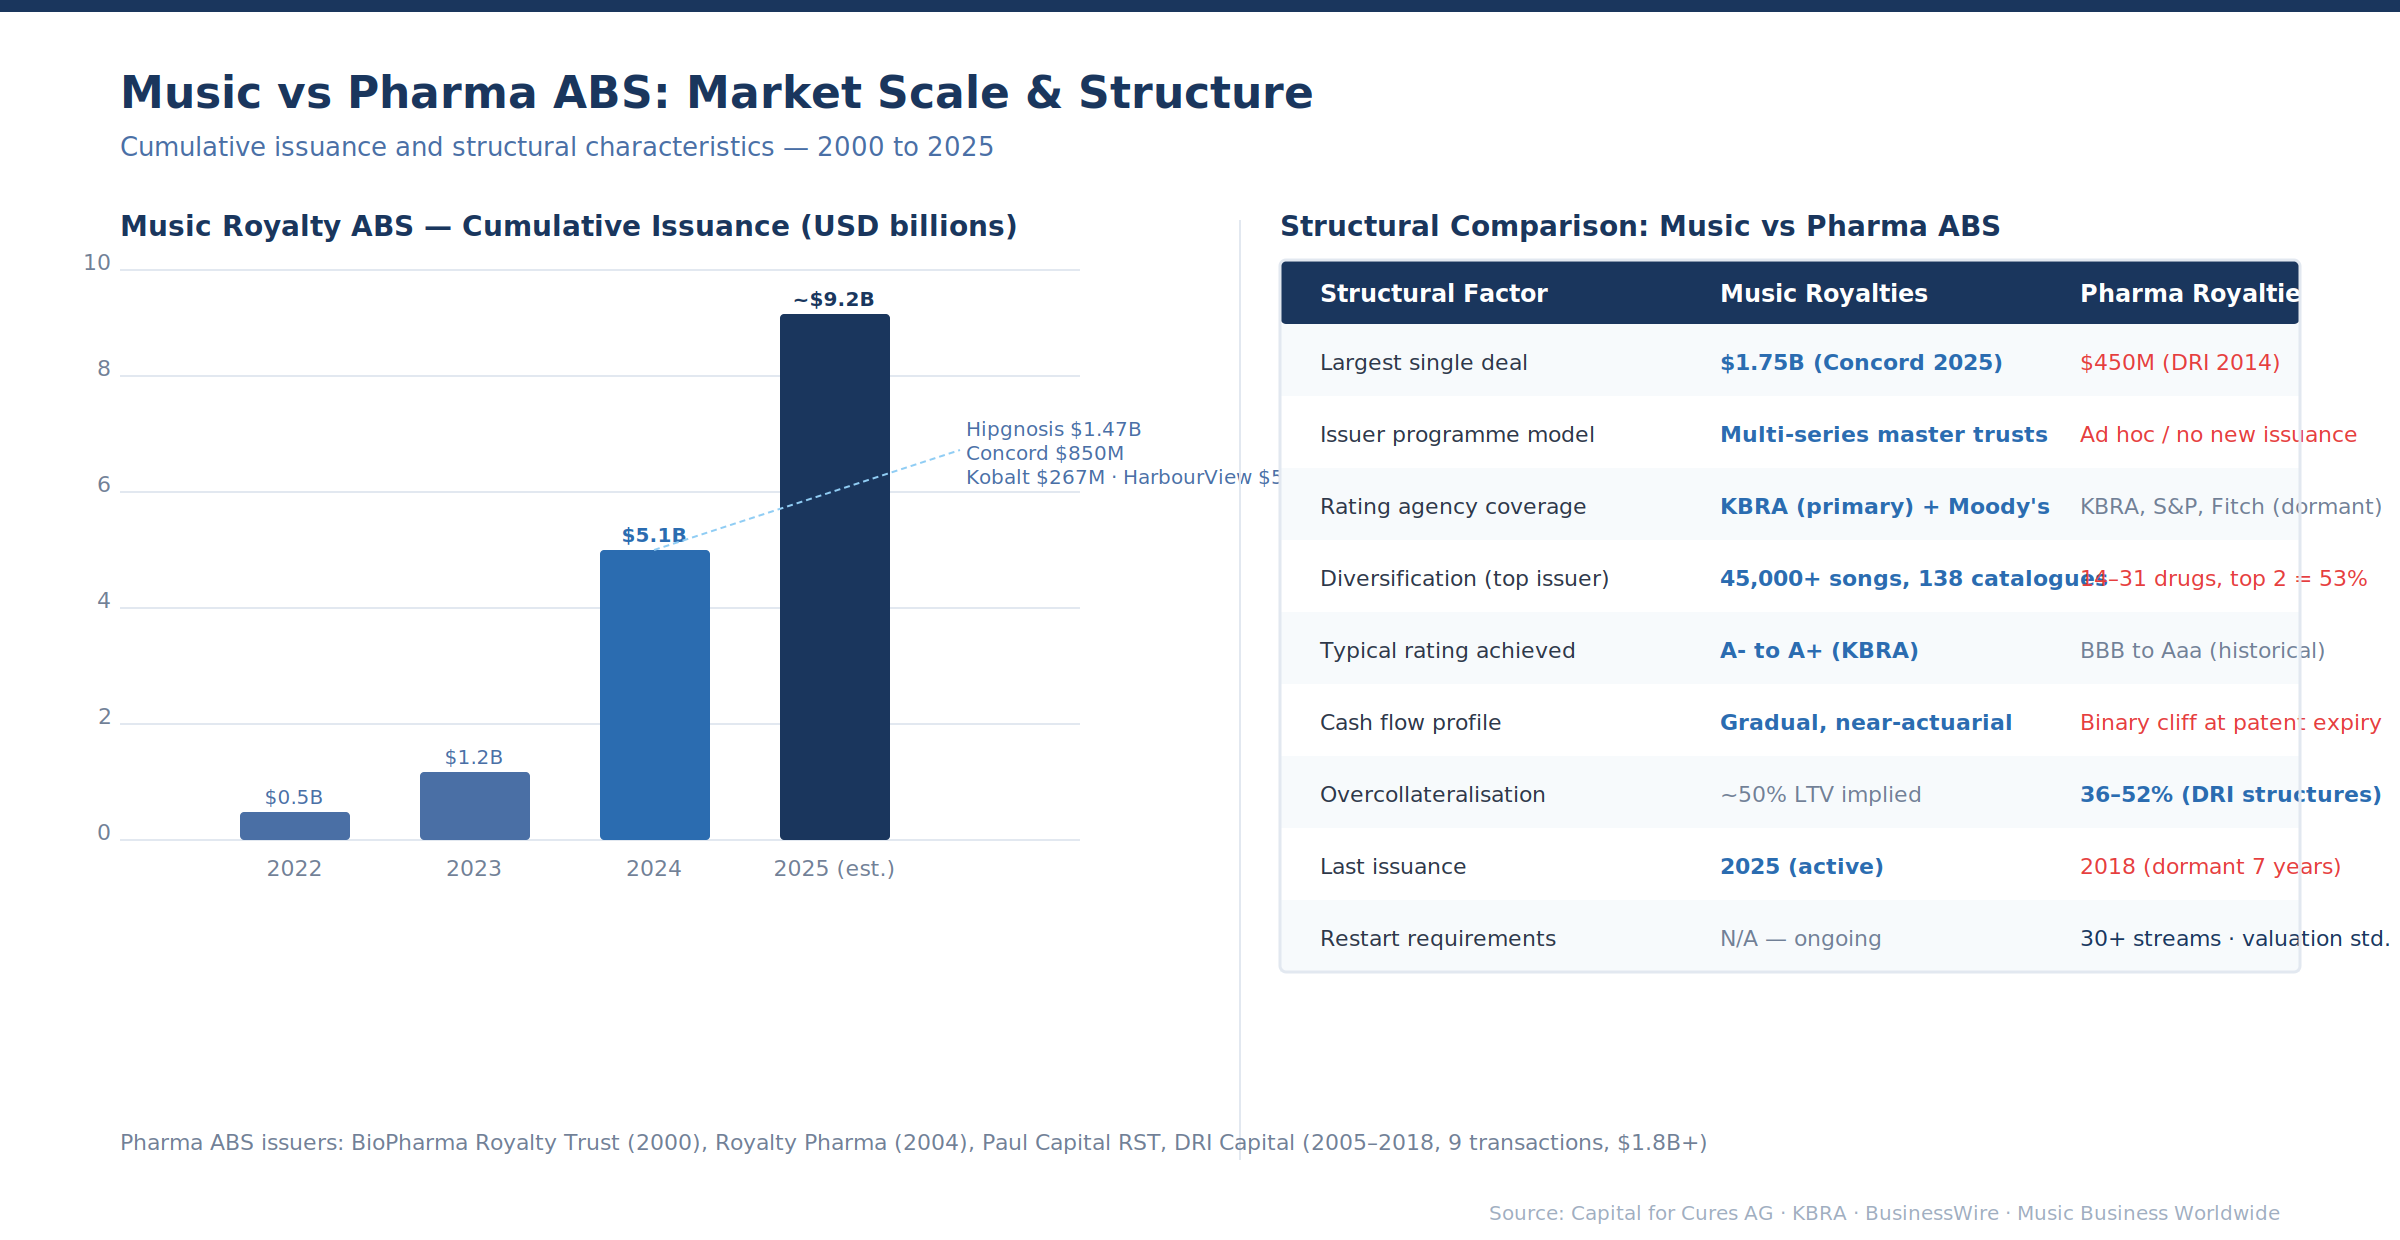
HarbourView secured approximately $500 million through private securitisation. SESAC Music Group closed $335 million. The pipeline is programmatic, with repeat issuers, established rating agency coverage, and growing investor bases — 25 investors in the Hipgnosis Lyra 24-2 deal alone.
Three structural differences explain why music scaled and pharma stalled.
Diversification arithmetic. Hipgnosis' $1.47 billion ABS was backed by 45,000 songs across 138 catalogues. The portfolio's concentration metrics are extraordinary: 76% of tracks were released over a decade ago, and the top songs generate the majority of revenue but the tail is enormous. Individual song failure is nearly irrelevant to the pool. DRI's 2017-1 deal had Keytruda at 35.8% and Odefsey at 17.1% of pool value — two drugs representing over half the collateral. A biosimilar launch or an IRA pricing negotiation affecting either would impair the entire structure.
The minimum number of drugs needed for a diversified pharma ABS with concentration limits comparable to music (top 5 assets below 25%) would require 30–40 independent royalty streams — more than most funds hold in their entire portfolio.
Cash flow predictability. Music catalogues generate predictable, gradually declining cash flows driven by cultural consumption patterns that are remarkably stable. Streaming has made this even more predictable: a hit from the 1980s generates millions of plays annually with near-actuarial regularity. KBRA can model music cash flows with the same tools it uses for auto loans and student debt.
Drug royalties have binary discontinuities: patent cliffs that destroy 70–80% of branded revenue within 12–18 months, IRA negotiation triggers, clinical holds, REMS programmes, and competitive displacement events. A pool of drug royalties does not behave like a statistically predictable portfolio of amortising assets. It behaves like a concentrated equity portfolio with embedded put options at each loss-of-exclusivity date.
Oil and gas royalties sit somewhere between: production decline curves are probabilistic (reserves are categorised as proved, probable, and possible for a reason), commodity prices are volatile, and individual wells can disappoint dramatically — but the analytical tools for modelling this uncertainty (type curves, Monte Carlo simulation, EUR estimation) are standardised and well-understood by rating agencies. Pharma lacks this shared analytical vocabulary.
Origination volume. The music ABS market now has cumulative issuance approaching $8–10 billion. Annual pharma royalty transaction volume is approximately $5 billion (Gibson Dunn), but this is the primary market — new royalty originations. Of this, only a fraction consists of mature, cash-flowing royalties that could serve as ABS collateral.
Phase 3 and pre-approval royalties carry too much binary risk for rated issuance. The investable universe for pharma royalty ABS is the pool of post-approval, commercially established drug royalties with sufficient remaining patent life — a subset that may be $2–3 billion at most in any given year.
What would restart it
The DRI master trust structure still exists. The rating methodology exists (KBRA, S&P, and Fitch have all rated pharma royalty ABS). Goldman Sachs has been structuring agent on multiple deals. The legal precedents for bankruptcy-remote SPVs, true-sale opinions, and UCC perfection against royalty payment rights are established.
What is missing is the origination pipeline and the data infrastructure to support programmatic issuance. A viable restart would require: (a) aggregation of 20–30+ post-approval royalty streams into a single pool, either by a single fund or through a syndicated origination model; (b) standardised valuation methodology that rating agencies can apply consistently; (c) ongoing surveillance and reporting infrastructure — the third-party sales consultant function that DRI used to ensure forecasts remained within 15% of actual; and (d) a structuring bank willing to commit balance sheet to warehousing royalties during the aggregation period.
This is a solvable infrastructure problem, not a fundamental impossibility.
Royalty Pharma's Capital Structure Evolution: The Template Nobody Copied
Royalty Pharma's progression from securitisation facility (2004) to syndicated term loan (2007) to public equity (2020) to unsecured investment-grade bonds (2020–2025) is the most important case study in pharmaceutical royalty capital markets — and the most underappreciated.
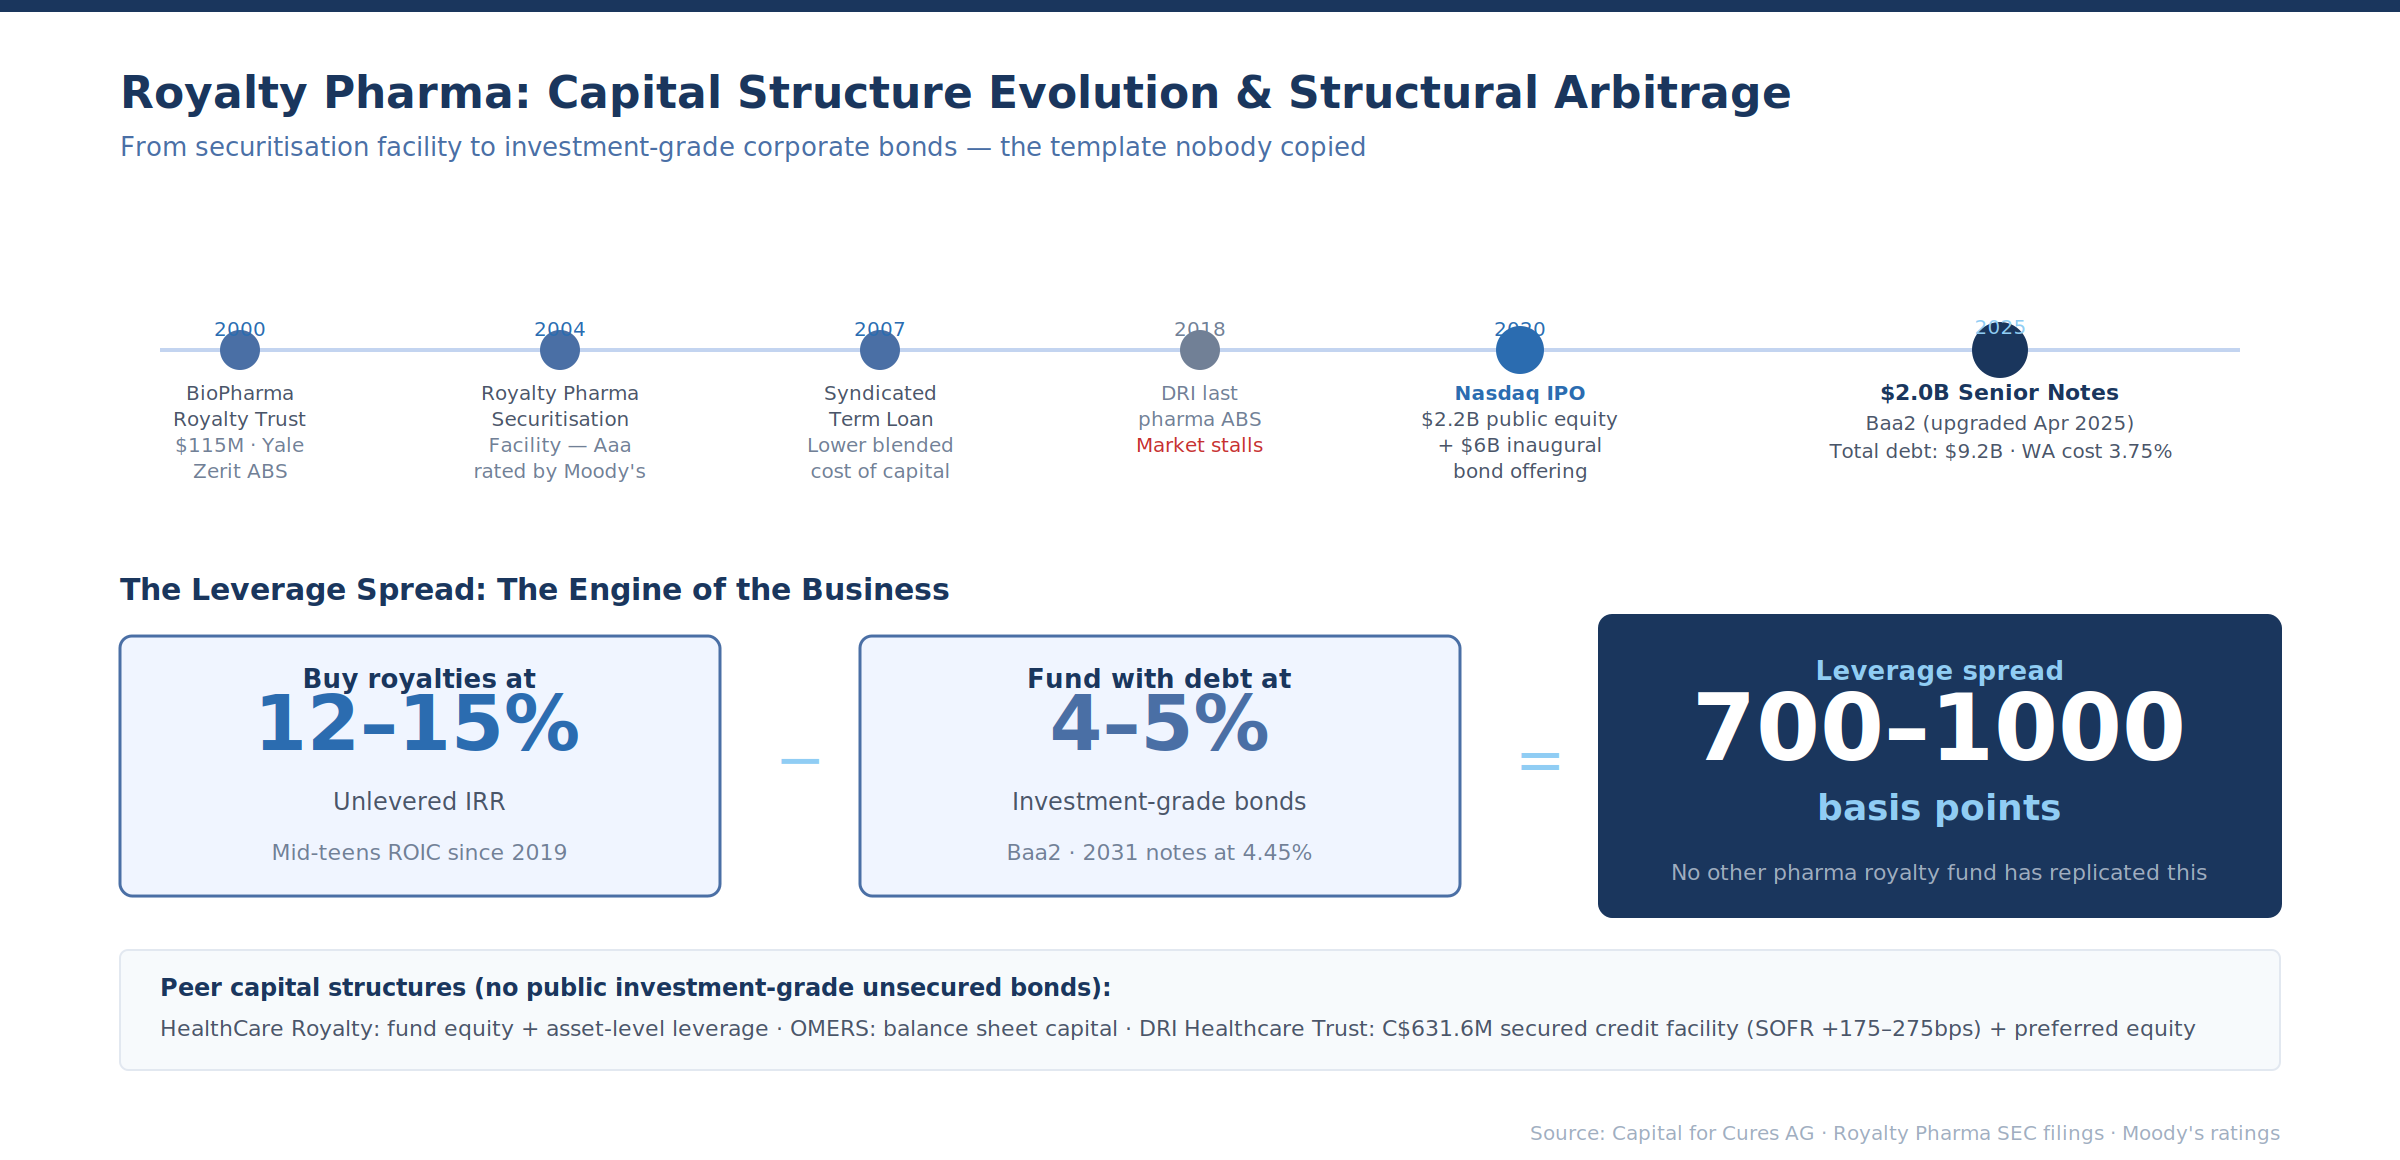
The September 2025 issuance — $2.0 billion across three tranches, rated Baa2 by Moody's — priced at levels that most pharmaceutical royalty investors would find startling. The 2031 notes at 4.45% and the 2035 notes at 5.20% represent a cost of capital far below the 12–18% unlevered IRRs that bilateral royalty transactions typically target. The 30-year tranche at 5.95% implies a credit profile that bond investors treat as comparable to a diversified pharmaceutical company, not a structured product.
This creates a structural arbitrage. Royalty Pharma can buy royalties yielding 12–15% unlevered and fund them with 4–5% investment-grade debt. The leverage spread — 700–1,000 basis points — is the engine of the business. No other pharmaceutical royalty fund has replicated this capital structure. HealthCare Royalty uses a combination of fund equity and asset-level leverage.
OMERS uses balance sheet capital. DRI Healthcare Trust has a C$631.6 million secured credit facility (SOFR + 175–275 basis points depending on leverage) and preferred equity with step-up coupons. None of them have public investment-grade unsecured bonds.
The relevance for other sectors: music royalty companies are following the same trajectory, but roughly 15 years behind. Hipgnosis moved from a publicly traded fund (equity) to private ownership (Blackstone) to ABS (debt). Concord went directly to programmatic ABS issuance. Neither has yet reached the investment-grade unsecured corporate bond stage. If the music market continues developing, someone will eventually issue investment-grade music royalty corporate bonds — and the precedent will be Royalty Pharma, not any music company.
Streaming: The Wheaton Model and Its Phantom Pharmaceutical Analogue
Mining's streaming model — pioneered by Silver Wheaton in 2004 and now supporting a combined market capitalisation exceeding $60 billion across Franco-Nevada, Wheaton Precious Metals, and Royal Gold — is the most commercially successful revenue-based financing innovation of the past two decades.
The concept: pay an upfront deposit, then purchase future physical commodity production at a predetermined price substantially below spot. The margin between the delivery price and market price is the streamer's return.
Franco-Nevada co-founder Pierre Lassonde identified the critical distinction: "We get a free perpetual option on the discoveries made on the land by the operators, and we get a free perpetual option on the price of gold. It's the optionality value of the land, the value of the operator spending money on our land, and the optionality on higher gold prices."
Wheaton's delivery payments currently average $473 per ounce of gold against a spot price above $2,600 — a margin exceeding $2,100 per ounce that expands with every dollar increase in the commodity price.
Pharmaceutical royalties are structured as a percentage of net sales — a revenue share. This is analogous to the mining royalty (a percentage of gross or net smelter return), not the stream. The streaming model does not have a direct pharmaceutical equivalent because there is no commodity to take physical delivery of.
But the economic principle — securing the right to purchase future output at a fixed below-market price — has two untested pharmaceutical applications.
Per-unit margin structures. Instead of a percentage of net sales, a financing instrument could entitle the investor to a fixed payment per unit sold (per tablet, per vial, per treatment course) regardless of the net selling price. This separates volume risk from pricing risk. In an environment where IRA negotiation, Medicaid rebates, and 340B discounting are compressing net sales per unit while prescribed volumes remain stable or grow, a per-unit instrument would have preserved more value for investors than a percentage-of-net-sales royalty.
Oil and gas VPPs already operate on exactly this principle — they are denominated in barrels, not dollars. The VPP holder's return depends on volume delivered and the prevailing commodity price at delivery.
By-product streams. The most lucrative mining streams have historically been on by-products — silver produced as a by-product of copper mining at Peñasquito, gold from Vale's Salobo copper mine. The by-product is not the miner's core business, so they are willing to sell the stream at a deep discount to raise capital for their primary operations.
A pharmaceutical analogue would be a stream on a secondary indication or a non-core geography. A company focused on oncology in the US and EU might sell the revenue rights to a dermatology indication in Japan at a steep discount — the pharma equivalent of selling by-product silver from a copper mine. This is not far from existing out-licensing transactions, but framing it as a "stream" with an upfront deposit and ongoing fixed delivery payments rather than milestones and royalties would create a different risk-return profile.
Volumetric Production Payments: Bankruptcy Remoteness That Pharma Needs
VPPs are a non-operating, non-expense bearing, limited-term overriding royalty interest carved out of a producer's working interest in specified oil and gas leases. The Haynes Boone overview describes the critical legal feature: under Section 541(b)(4)(B) of the U.S. Bankruptcy Code, properly documented VPPs are excluded from the debtor's bankruptcy estate. The VPP holder has continued access to its share of production during the pendency of a producer's bankruptcy.
The VPP structure carries its own substantial risks — the predetermined production volume may never materialise if reservoir performance disappoints, and the producer may go bankrupt before delivery is complete (the bankruptcy safe harbour protects access to production, not production itself). But the legal architecture for protecting investor interests through estate exclusion is the critical innovation.
This statutory safe harbour does not exist for pharmaceutical royalties. A synthetic royalty investor relies on a perfected security interest under UCC Article 9, which gives priority in the distribution waterfall but does not exclude the asset from the estate.
As I discussed in The Royalty Swap, the post-Mallinckrodt landscape has made this a central structuring concern — the Covington guide to synthetic royalty dealmaking documents the near-universal requirement for first-priority security interests in royalty financings since 2020.
The VPP structure achieves estate exclusion by being classified as a conveyance of a real property interest rather than a contractual claim. Pharmaceutical IP is not real property. But the principle — structuring a revenue interest as a true sale of a property right rather than a secured loan — is achievable through careful legal engineering. True-sale opinions, absolute assignment structures, and bankruptcy-remote SPVs are standard tools in other securitisation markets.
The reason pharma has not pushed this boundary harder is partly that the market is young (most synthetic royalties were originated after 2019) and partly that the existing security interest approach has not yet been tested in a major pharma bankruptcy.
When it is tested — and if the result is unfavourable — the demand for VPP-like bankruptcy remoteness in pharma will become acute. The oil and gas playbook will be waiting.
Net Profits Interests: Why Pharma Actively Avoids Them
Oil and gas finance distinguishes between gross royalties (calculated on revenue before deductions) and net profits interests (NPIs), which are calculated after deducting specified costs. An NPI holder receives nothing until the property generates net profits after capital expenditures, operating costs, severance taxes, and other negotiated deductions. King & Spalding's analysis notes that there is no generally accepted method of calculating net profits — each NPI is the bespoke product of negotiation, defined entirely by the governing contract.
Pharmaceutical royalties are overwhelmingly based on net sales — a measure that deducts returns, rebates, discounts, and chargebacks from gross revenue but does not deduct manufacturing costs, R&D expenses, or SG&A. This is the pharma equivalent of a gross overriding royalty, not a net profits interest.
The avoidance is deliberate and rational. An NPI on a drug would expose the investor to the company's operating efficiency, cost allocation decisions, and commercial execution — risks that passive royalty investors explicitly seek to avoid. Oil and gas manages these risks through detailed accounting procedures (often referencing the PASC Accounting Procedure), operator oversight committees, and audit rights developed over decades. Pharma has not built this infrastructure because it has never needed to.
There is one structural context where pharmaceutical NPIs could emerge: co-development structures where the financing party absorbs development or manufacturing costs. A CDMO providing manufacturing capacity for a Phase 3 candidate could receive an NPI — participating in commercial upside only after its manufacturing costs are recovered. This replicates the oil and gas dynamic where the NPI holder's payout is deferred until the working interest holder recovers drilling and completion costs. It aligns incentives without requiring the biotech to provide upfront cash — the CDMO's capital contribution is the manufacturing capacity itself.
Publicly Traded Royalty Vehicles: A $60 Billion Proof of Concept
The mining sector's publicly traded royalty and streaming companies represent the most compelling evidence that pharmaceutical royalties could support a broader capital markets ecosystem.
Franco-Nevada has 434 assets — 120 producing, 38 advanced-stage, and 276 exploration — across gold, silver, platinum group metals, oil and gas. Market capitalisation exceeds $24 billion. It was spun out of Newmont in a C$1.1 billion IPO in 2007. Wheaton Precious Metals has investments in 23 operating mines and 25 development projects, expecting production of 870,000 gold equivalent ounces by 2029 and 950,000 annually by 2030. Royal Gold holds NSR royalties on flagship operations including Mount Milligan and Cortez.
Together, the top three companies represent approximately 80% of the total value of streaming and royalty contracts in mining, with a combined market capitalisation exceeding $60 billion. They trade at 40–50x earnings — a premium that reflects the embedded optionality that Pierre Lassonde described.
The pharmaceutical market actually has more publicly traded royalty-oriented vehicles than is commonly recognised — four as of March 2026:
Royalty Pharma (Nasdaq: RPRX, market cap ~$25 billion) is the dominant player, with royalties on over 35 commercial products and 14 development-stage candidates. Founded in 1996 by Pablo Legorreta, it IPO'd in June 2020 raising $2.2 billion and has since built a $9.2 billion unsecured bond programme rated Baa2 by Moody's.
In January 2025, it announced the internalization of its external manager, and in January 2026 announced a $500 million funding agreement with Teva for development of TEV-'408, an anti-IL-15 antibody. Full-year 2026 portfolio receipts guidance is $3.275–3.425 billion.
DRI Healthcare Trust (TSX: DHT.UN / DHT.U, market cap ~C$634 million) has the longest institutional lineage in pharmaceutical royalty investing — and the most turbulent recent history. The entity traces back to Drug Royalty Corporation, founded in 1989 and originally publicly traded on the TSX. In 1994, DRC signed a royalty deal with Cambridge Antibody Technology that would later trigger a hostile takeover battle.
In January 2002, CAT offered to buy DRC for C$3.00 per share to extinguish its royalty obligation; the Khosrowshahi family's investment vehicle Inwest outbid CAT at C$3.05 per share in cash. Inwest privatised DRC in May 2002, and Behzad Khosrowshahi became CEO. The company rebranded to DRI Capital in 2007, and through three private fund vintages — Drug Royalty I ($240M equity, 2006), Drug Royalty II ($926M, 2010), and Drug Royalty III ($1.45B, 2013) — became the oldest and largest healthcare royalty private equity fund manager in the world, deploying over $3 billion across 75+ royalties on 45+ drugs.
Between 2005 and 2018, DRI's Drug Royalty III fund issued $1.8 billion in rated ABS through nine securitisation transactions — the most prolific pharma royalty securitisation programme ever.
In early 2021, DRI returned to public markets through a TSX IPO as DRI Healthcare Trust, converting from the private fund model to a publicly traded trust structure. The trust was externally managed by DRI Capital Inc. (still owned by the Khosrowshahi family) under a management agreement charging 6.5% of royalty receipts plus performance fees — a structure that drew persistent criticism from investors.
Then came the governance crisis. In July 2024, the board disclosed an investigation into "irregularities related to certain alleged consulting and other expenses" presented by Behzad Khosrowshahi for reimbursement. The Globe and Mail reported that the investigation concerned at least $7.5 million in irregular reimbursements, with capital allegedly siphoned into personal accounts.
The board demanded and received Khosrowshahi's immediate resignation. Units dropped nearly 30% in a single session, from C$15.24 to C$11.17. The CFO was suspended. Investor class action litigation followed. In July 2025, DRI Healthcare completed an internalization transaction, terminating the management agreement with DRI Capital Inc. for a $48 million termination payment and acquiring the manager's assets for $1 million.
Ali Hedayat, previously of Goldman Sachs, became CEO. As of early 2026, the trust holds 28 royalty streams on 21 products and pays a quarterly distribution of US$0.10 per unit.
The DRI story illustrates both the potential and the governance risks of the publicly traded pharma royalty model. A 34-year track record of successful royalty investing was nearly destroyed by an expense fraud scandal — a risk that passive oil and gas trusts avoid by design (no external manager, no discretionary spending, no governance complexity beyond the trust indenture).
XOMA Royalty Corporation (Nasdaq: XOMA) pivoted from a traditional antibody biotech in 2017 to become a royalty aggregator focused on pre-commercial and early-stage clinical assets — a differentiated niche versus Royalty Pharma's focus on commercial-stage royalties. XOMA acquires milestone and royalty payment rights on partnered drug candidates, providing non-dilutive, non-recourse capital to sellers. Its portfolio includes royalties on Roche's blockbuster eye drug Vabysmo, among others.
In February 2026, XOMA completed its acquisition of Generation Bio (formerly Nasdaq: GBIO) for $4.29 per share, adding Moderna-partnered milestone and royalty rights. XOMA's model — buying early, accepting binary clinical risk, and waiting for portfolio maturation — is the pharmaceutical equivalent of a mining exploration royalty company.
Ligand Pharmaceuticals (Nasdaq: LGND) transformed from a drug developer under CEO John Higgins (from 2007) into a diversified royalty and technology licensing company. After selling its Promacta royalty to Royalty Pharma for $827 million in 2019, spinning off its OmniAb antibody discovery platform as a standalone public company in 2022, and spinning out Pelican Technology into Primrose Bio in 2023, Ligand now holds economic rights to more than 30 commercial programmes marketed in over 70 countries, plus 100+ partnered development-stage programs.
Notable royalty-generating products include Kyprolis (multiple myeloma), Evomela, Filspari (kidney disease), Vaxneuvance (pneumococcal vaccine), and Ohtuvayre (COPD). Ligand also licenses its Captisol drug delivery technology, generating recurring revenue from partners including Pfizer, Gilead, and Amgen. In July 2024, Ligand acquired Apeiron Biologics for the royalty rights to Qarizba (neuroblastoma). Ligand hosted its 2025 Investor Day in December and introduced 2026 guidance.
Together, these four companies represent a combined publicly traded pharmaceutical royalty and milestone market capitalisation exceeding $26 billion. This is meaningful, but it remains less than half the market capitalisation of Franco-Nevada alone — and fundamentally different in structure. All four are actively managed operating companies with discretionary investment programmes, employee costs, and governance complexity. None is a passive trust.
The oil and gas model — a Permian Basin–style vehicle that holds a fixed set of royalties, pays monthly distributions, and requires no management judgment — does not yet exist in pharma.
Oil and gas has maintained passive royalty trusts since 1980. The Permian Basin Royalty Trust (NYSE: PBT) holds a 75% net overriding royalty interest in Waddell Ranch properties and a 95% NORRI in Texas Royalty properties across 33 counties. It pays monthly distributions, trades like a stock, and has been doing so for 45 years. Sabine Royalty Trust, San Juan Basin Royalty Trust, PermRock Royalty Trust, Dorchester Minerals, and Kimbell Royalty Partners (17 million gross acres in 28 states, 131,000+ gross wells) provide similar passive exposure. These vehicles have attracted retail investors who want commodity exposure without operational risk — the same value proposition that pharmaceutical royalty trusts could offer.
The barrier to pharmaceutical royalty trusts is not structural — it is informational, though the comparison is less clean than it first appears. A Permian Basin unitholder's return is a function of oil prices and well production rates — but neither is truly predictable. Reserve estimates are probabilistic (proved, probable, possible), decline curve assumptions vary wildly between reservoir engineers, and production can disappoint catastrophically when geological models prove wrong.
The 2015–2016 oil price collapse destroyed Linn Energy's royalty trust, which filed for Chapter 11 in May 2016, and the Chesapeake Granite Wash Trust traded below $1 for years as production from its underlying wells declined faster than projected. Oil and gas investors learned — repeatedly and painfully — that "royalty" does not mean "safe."
Yet the market survived these failures and continued to attract retail capital. The reason is that oil and gas price risk is continuous and observable (WTI futures trade 24 hours a day), production data is reported monthly, and the core analytical framework — decline curve analysis, type curves, EUR estimation — is standardised and teachable. An individual well may surprise, but a portfolio of thousands of wells across 28 states (Kimbell's 131,000+ gross wells) behaves statistically. The uncertainty is quantifiable.
Pharmaceutical royalty risk is different in kind, not just degree. A drug's commercial trajectory can be modelled with sales forecasts and patient population estimates, but the discontinuities — patent invalidation, IRA negotiation selection, unexpected safety signals, biosimilar launches — are binary and non-diversifiable within a single asset.
The uncertainty is not "will production decline 8% or 12% this year" but "will this $2 billion revenue stream go to zero in 18 months." This creates adverse selection risk: the investors best positioned to evaluate these binaries are the same specialists who already participate in the bilateral market and have no need for a publicly traded vehicle.
The resolution may come from the same place it came in both mining and oil and gas: portfolio scale that converts idiosyncratic binary risk into statistical distributions. Franco-Nevada's 434 assets mean that any individual mine closure or sovereign risk event is portfolio noise. Kimbell's 131,000+ gross wells mean that any individual well's decline rate is irrelevant.
A pharmaceutical royalty trust with 50+ mature, cash-flowing royalties diversified across therapeutic areas, geographies, and patent expiry dates would exhibit cash flow characteristics much closer to these portfolios than a single drug bet. The question is whether anyone will assemble such a portfolio and list it — and whether the $29.4 billion in royalty transactions originated between 2020 and 2024 (Gibson Dunn) has created a sufficient base of seasoned assets to populate the vehicle.
Fractional Platforms and Retail Access: The SongVest Model
SongVest offers SEC-qualified fractional shares of individual song royalties under Regulation A+. Investors purchase "SongShares" — fractional interests in a song's royalty stream — and receive quarterly distributions. The legal structure works: the fractionalised royalty is registered with the SEC, qualified for sale to retail investors, and backed by a contractual right to the underlying royalty income for the life of copyright (70 years after death of the last author).
Over $15 million in cumulative sales. Royalty Exchange runs auctions where investors purchase 100% of royalty assets directly. JKBX offers micro-ownership of royalty income. EnergyNet does the same for oil and gas mineral interests.
Pharmaceutical royalties have no equivalent retail access platform. The minimum investment in a bilateral royalty transaction is typically $10–50 million. There is no Regulation A+ offering for a fractional share of a 5% royalty on Keytruda.
The legal framework exists. Regulation A+ permits SEC-qualified offerings of up to $75 million annually to retail investors. The challenge is disclosure: how do you write an offering circular for a fractional pharmaceutical royalty that a retail investor can understand? SongVest works because everyone knows TLC and Queen.
The emotional connection drives purchase decisions, and the financial returns are secondary. A fractional share of a royalty on a CDK4/6 inhibitor in HR+/HER2- breast cancer does not have the same emotional pull.
The more realistic path to retail access is through diversified vehicles rather than individual drug royalties: a pharmaceutical royalty ETF, a publicly traded trust, or a fractionalised fund-of-royalties. The MUSQ Global Music Industry ETF (launched 2023) includes 48 stocks across five categories of the modern music business — streaming, content distribution, live music, satellite radio, and equipment.
A pharmaceutical royalty ETF could include all four publicly traded royalty-oriented companies — Royalty Pharma, DRI Healthcare Trust, XOMA Royalty, and Ligand Pharmaceuticals — weighted by market cap or royalty revenue. It would not provide direct royalty exposure, but it would create a tradeable proxy — a starting point for retail market development.
Carbon Credit Royalties: The Latest Cross-Sector Migration
The royalty and streaming model's most recent cross-sector migration is into carbon credits. Star Royalties, through its Green Star Royalties joint venture with Agnico Eagle Mines and Cenovus Energy, provides upfront capital to carbon offset project developers in exchange for a percentage of future carbon credit revenue — gross revenue royalties and proceeds-sharing royalties, exactly mirroring the mining model.
Carbon Streaming Corporation paid $3 million for a 5% royalty on carbon credit revenues from four REDD+ projects in the Brazilian Amazon, generating approximately 68.3 million tonnes of CO₂-equivalent emission reductions over 30-year project lives.
The structural parallels to pharma are striking. Carbon credit output is uncertain and dependent on regulatory frameworks (Verra verification, carbon registry standards). Individual projects carry binary risk. Pricing is volatile and policy-dependent. The market is developing standardised valuation methodologies. Duration is long but finite (30-year project lives).
If the royalty model can work for carbon credits — an asset class with even less standardisation and track record than pharmaceutical royalties — the infrastructure-first objection to pharma royalty market development loses force.
The Derivative Layer: What Could Be Built on Top
Other royalty markets have not developed a meaningful derivatives layer. There are no royalty swaps, no royalty options, and no credit default swaps referencing royalty cash flows in any sector. But the structural building blocks exist, and the economic rationale is clear.
Royalty revenue swaps. A biotech retains its royalty but enters a swap: fixed quarterly payments in exchange for passing through variable royalty income. This is functionally what Royalty Pharma's MorphoSys Development Funding Bonds achieved — $300 million in upfront capital with fixed repayment obligations, later monetised for $511 million at a 5.35% discount rate.
Reframing this as a swap rather than a bond eliminates the true-sale requirement, keeps the royalty on the originator's balance sheet, and avoids notification obligations to the obligor (the pharma company paying the royalty). The swap counterparty takes the commercial risk; the originator takes the credit risk of the counterparty.
Patent life / LOE insurance. The closest analogue to a credit default swap for pharma royalties would be a product that pays out if a drug loses exclusivity earlier than expected — whether through patent invalidation, unexpected generic entry, regulatory action, or biosimilar approval ahead of schedule. The premium would be a function of remaining patent life, litigation risk, and competitive pipeline.
The payout would compensate the royalty holder for the present value of lost cash flows. Insurance markets already price pharmaceutical risk through clinical trial insurance and product liability coverage. Extending this to commercial exclusivity risk is a logical next step, and the pricing framework exists in the form of probability-adjusted royalty valuation models that every specialist investor already maintains.
Tracker certificates and structured notes. Swiss and German retail structured product markets issue tracker certificates on virtually every asset class — commodity baskets, equity indices, real estate, infrastructure, and thematic investment strategies. A tracker certificate referencing a basket of pharmaceutical royalties — constructed to replicate the risk-return profile of a diversified royalty portfolio — would provide retail investors with synthetic exposure without requiring direct ownership of royalty assets.
The certificate issuer (typically a bank) hedges by entering into total return swaps with royalty holders or by holding a portfolio of royalty-linked instruments. The regulatory framework for this exists under MiFID II and the Swiss Financial Services Act. The missing input is a transparent, observable index of pharmaceutical royalty returns — the benchmark that a certificate needs to track.
The Convergence Thesis
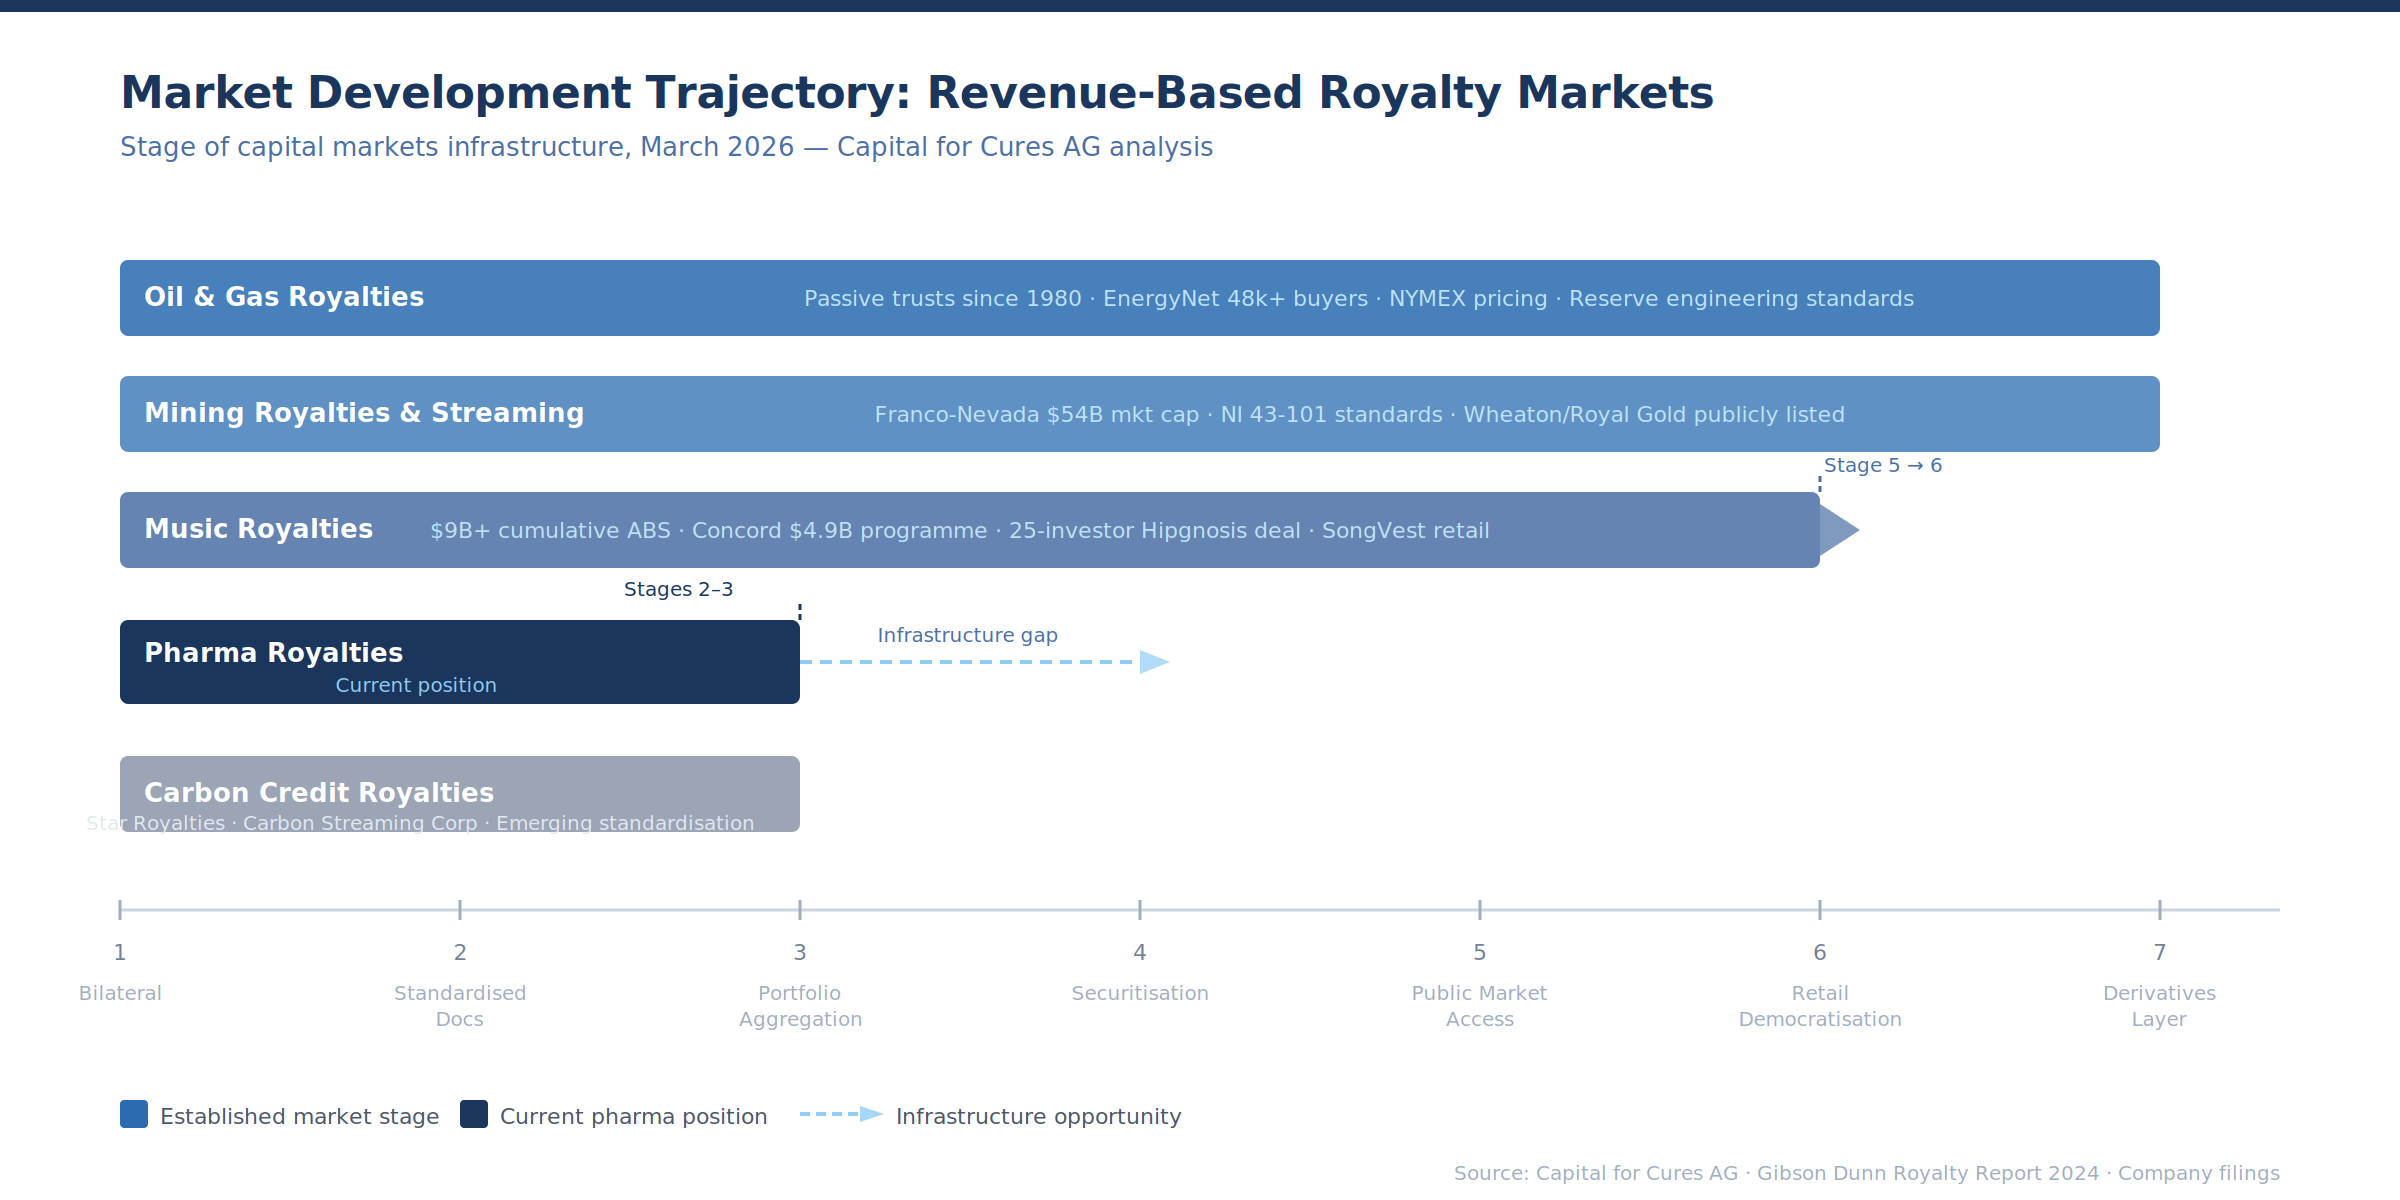
Each revenue-based financing market has developed along the same trajectory: bilateral transactions → standardised documentation → portfolio aggregation → securitisation → public market access → retail democratisation → derivatives layer.
Music is at stage 5, moving toward 6. Mining is at stage 6 for publicly traded royalty companies, at stage 4–5 for streaming. Oil and gas spans the full spectrum — passive trusts and mineral auctions have been available to retail investors for decades, while VPP securitisation serves institutional markets.
Carbon credits are at stage 2–3. Pharmaceutical royalties are between stages 2 and 3: the bilateral transaction market is established at $5+ billion annually, standardised documentation is emerging through legal surveys (Covington, Gibson Dunn, Goodwin), and portfolio aggregation exists through Royalty Pharma and HealthCare Royalty but has not yet produced new tradeable securities.
The speed of progression along this trajectory depends on three factors that are all improving simultaneously. First, origination volume: $29.4 billion in transactions from 2020 to 2024 is creating a base of seasoned royalty assets that did not exist five years ago.
Second, data infrastructure: transparent valuation methodologies, standardised reporting, and comparable analytics are the prerequisites for everything from rating agency engagement to retail offering circulars.
Third, institutional familiarity: KKR (through HealthCare Royalty), Blackstone, sovereign wealth funds, and large pension funds are now active in the asset class, bringing the structural expectations and capital markets expertise they apply elsewhere.
The next instrument to appear in pharmaceutical royalty financing will not be invented from scratch. It will be imported from a sector that already built it — adapted for patent cliffs instead of production decline curves, probability-adjusted for clinical risk instead of geological risk, and structured around UCC Article 9 instead of overriding royalty interest conveyances. The toolkit exists. The question is who assembles it first.
All information in this report was accurate as of the research date and is derived from publicly available sources including company press releases, SEC filings, regulatory announcements, financial news reporting, and rating agency reports. Information may have changed since publication. This content is for informational purposes only and does not constitute investment, legal, or financial advice.
Member discussion