
Royalty on Net Sales vs. Net Profits: Why the Definition of the Base Matters More Than the Rate

When two pharmaceutical companies or a biotech and a royalty fund negotiate a royalty agreement, the headline debate is almost always about the rate. A licensor argues for 8%. The licensee counters with 5%. They settle at 6.5%, and everyone calls it a done deal.
That conversation is the wrong one. The rate is a multiplier. The base is what you multiply it against. A 6% royalty on one party's definition of "net sales" can produce fundamentally different cash flows from a 6% royalty on another party's definition of the same term — even when the product, the market, and the commercial trajectory are identical. Over the lifecycle of a successful drug, the difference between a royalty base defined tightly and one defined loosely can amount to hundreds of millions of dollars.
This article examines why the definition of the royalty base is the most consequential clause in any pharmaceutical royalty agreement, how the deduction landscape has changed under the Inflation Reduction Act and the evolving 340B program, and how sophisticated parties negotiate the provisions that determine whether an investor's return model holds together.
Part I: The Two Bases and Why They Are Not Equivalent
Net Sales
Net sales is the dominant base in pharmaceutical royalty agreements. It is defined in virtually every transaction as gross revenue from product sales to third parties, less an enumerated list of deductions. Because manufacturers report net sales in their financial statements under both ASC 606 and IFRS 15, it has the virtue of being auditable against published figures — at least for public companies with marketed products.
The typical SEC-filed license agreement defines net sales as gross amounts invoiced to unaffiliated third parties, reduced by:
- Trade and cash discounts
- Chargebacks to wholesalers and distributors
- Medicaid and other government rebates (required under the Omnibus Budget Reconciliation Act of 1990)
- Commercial rebates and allowances to pharmacy benefit managers, managed care organisations, and similar payers
- Product returns and recalls
- Sales taxes, value-added taxes, and duties imposed on the transaction
- Freight, insurance, and shipping costs (if included in invoice price)
The precise formulation of each item, and the items that are omitted, is where the economics are determined.
Net Profits
Net profits royalties exist but are uncommon in pure royalty financing structures. They were more prevalent in co-promotion and co-commercialisation agreements from the 1990s and early 2000s, particularly in deals where both parties contributed to commercial expenses and shared the resulting profit pool. As the pharma licensing industry matured, the consensus view crystallised: profit-sharing is operationally treacherous and analytically opaque.
Royalty Rates for Pharmaceuticals and Biotechnology (9th Edition), the standard industry reference, states the point plainly: profit-sharing arrangements are "fraught with the potential for future difficulties" because disagreements about expense allocation "can turn happy partners into litigants."
In practice, almost no institutional royalty transaction from the past decade — none of Royalty Pharma's disclosed deals, none of HealthCare Royalty's published structures, and none of the Gibson Dunn 2020–2024 royalty survey transactions — are structured on a net profit base.
The reason is fundamental: net profit is determined after the licensee allocates costs, and cost allocation is an exercise in discretion. Sales force expenses, manufacturing overhead, post-launch R&D, co-pay assistance programmes, and head-office allocations are all legitimate charges against a product's P&L — but each one is also a lever that a commercially motivated licensee can adjust.
The result is that a royalty investor holding a net profit interest is functionally at the mercy of the licensee's accounting choices for the duration of the agreement.
| Feature | Net Sales Royalty | Net Profits Royalty |
|---|---|---|
| Industry prevalence | Dominant in all institutional deals | Rare; legacy co-promotion structures |
| Auditability | Reconcilable to reported financials | Requires full cost allocation audit |
| Manipulation risk | Low (limited deductions) | High (broad expense discretion) |
| Early-stage viability | Strong (revenue precedes profit) | Weak (losses common pre-peak) |
| Investor preference | Universal | Avoided |
| Typical rates | 3–15% | 15–30% |
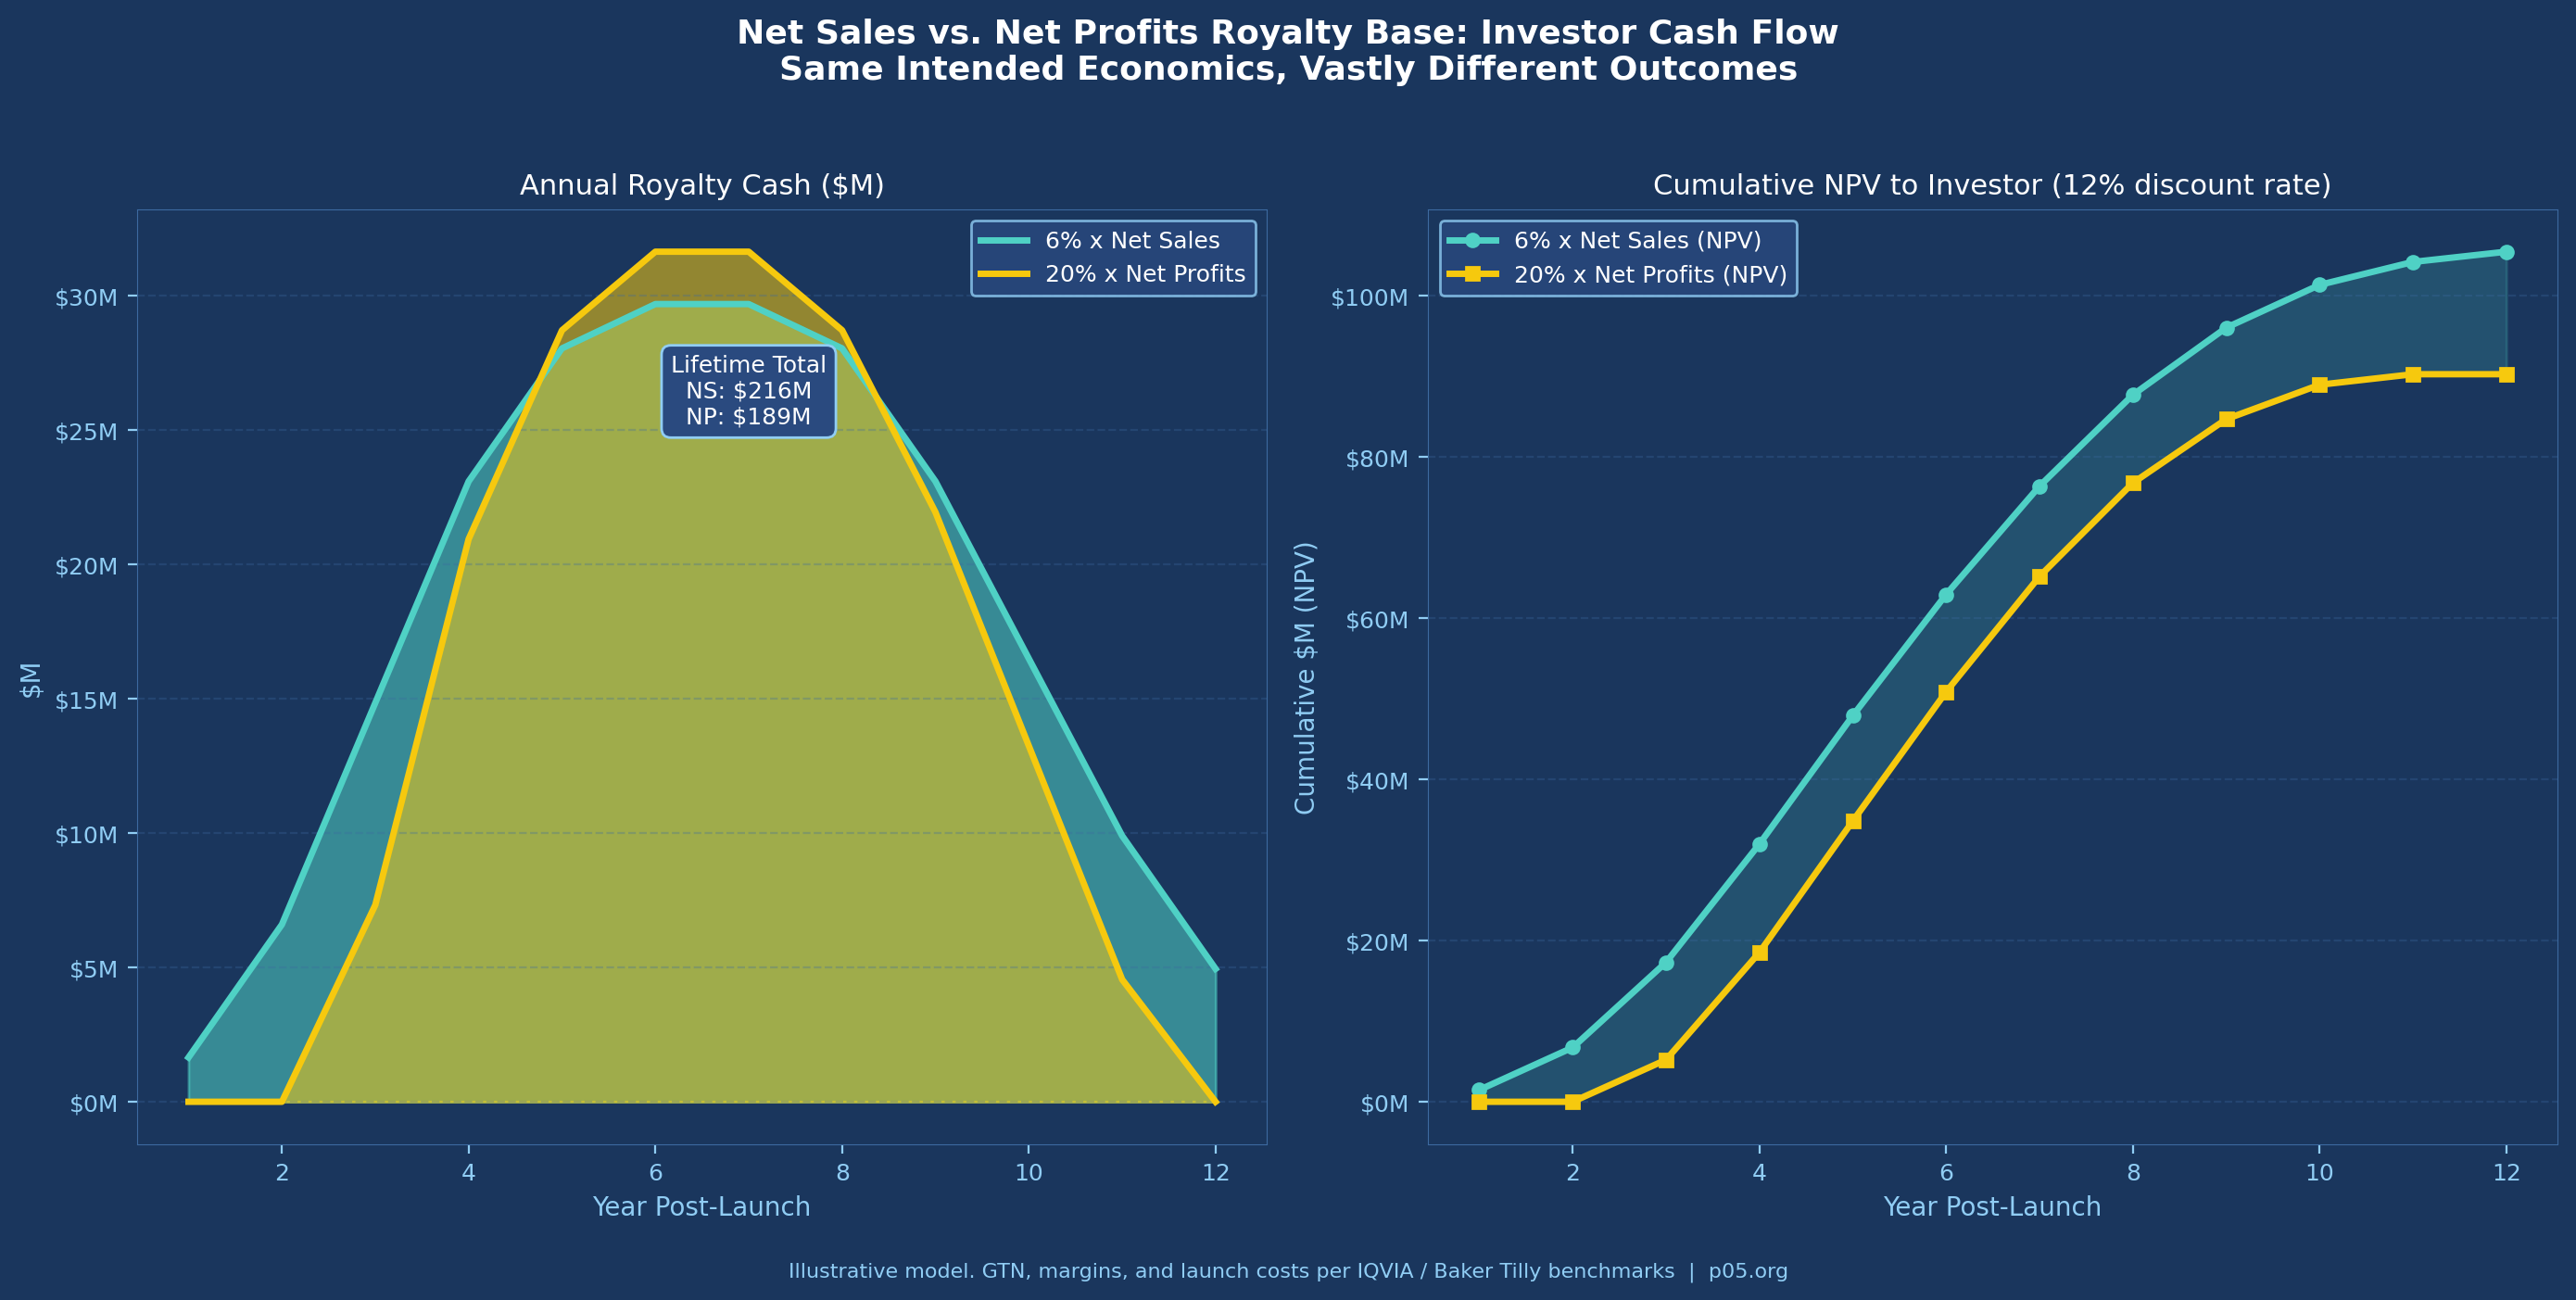
The table understates the comparison in one critical respect: a net profit royalty is worth nothing in any year the product runs at an operating loss. For a newly launched product with substantial commercial investment, the early years of a royalty term — often the most valuable in NPV terms — generate zero return under a profit base. A 6% net sales royalty begins generating cash on day one of commercial sale.
Part II: The Gross-to-Net Gap and Why It Has Widened
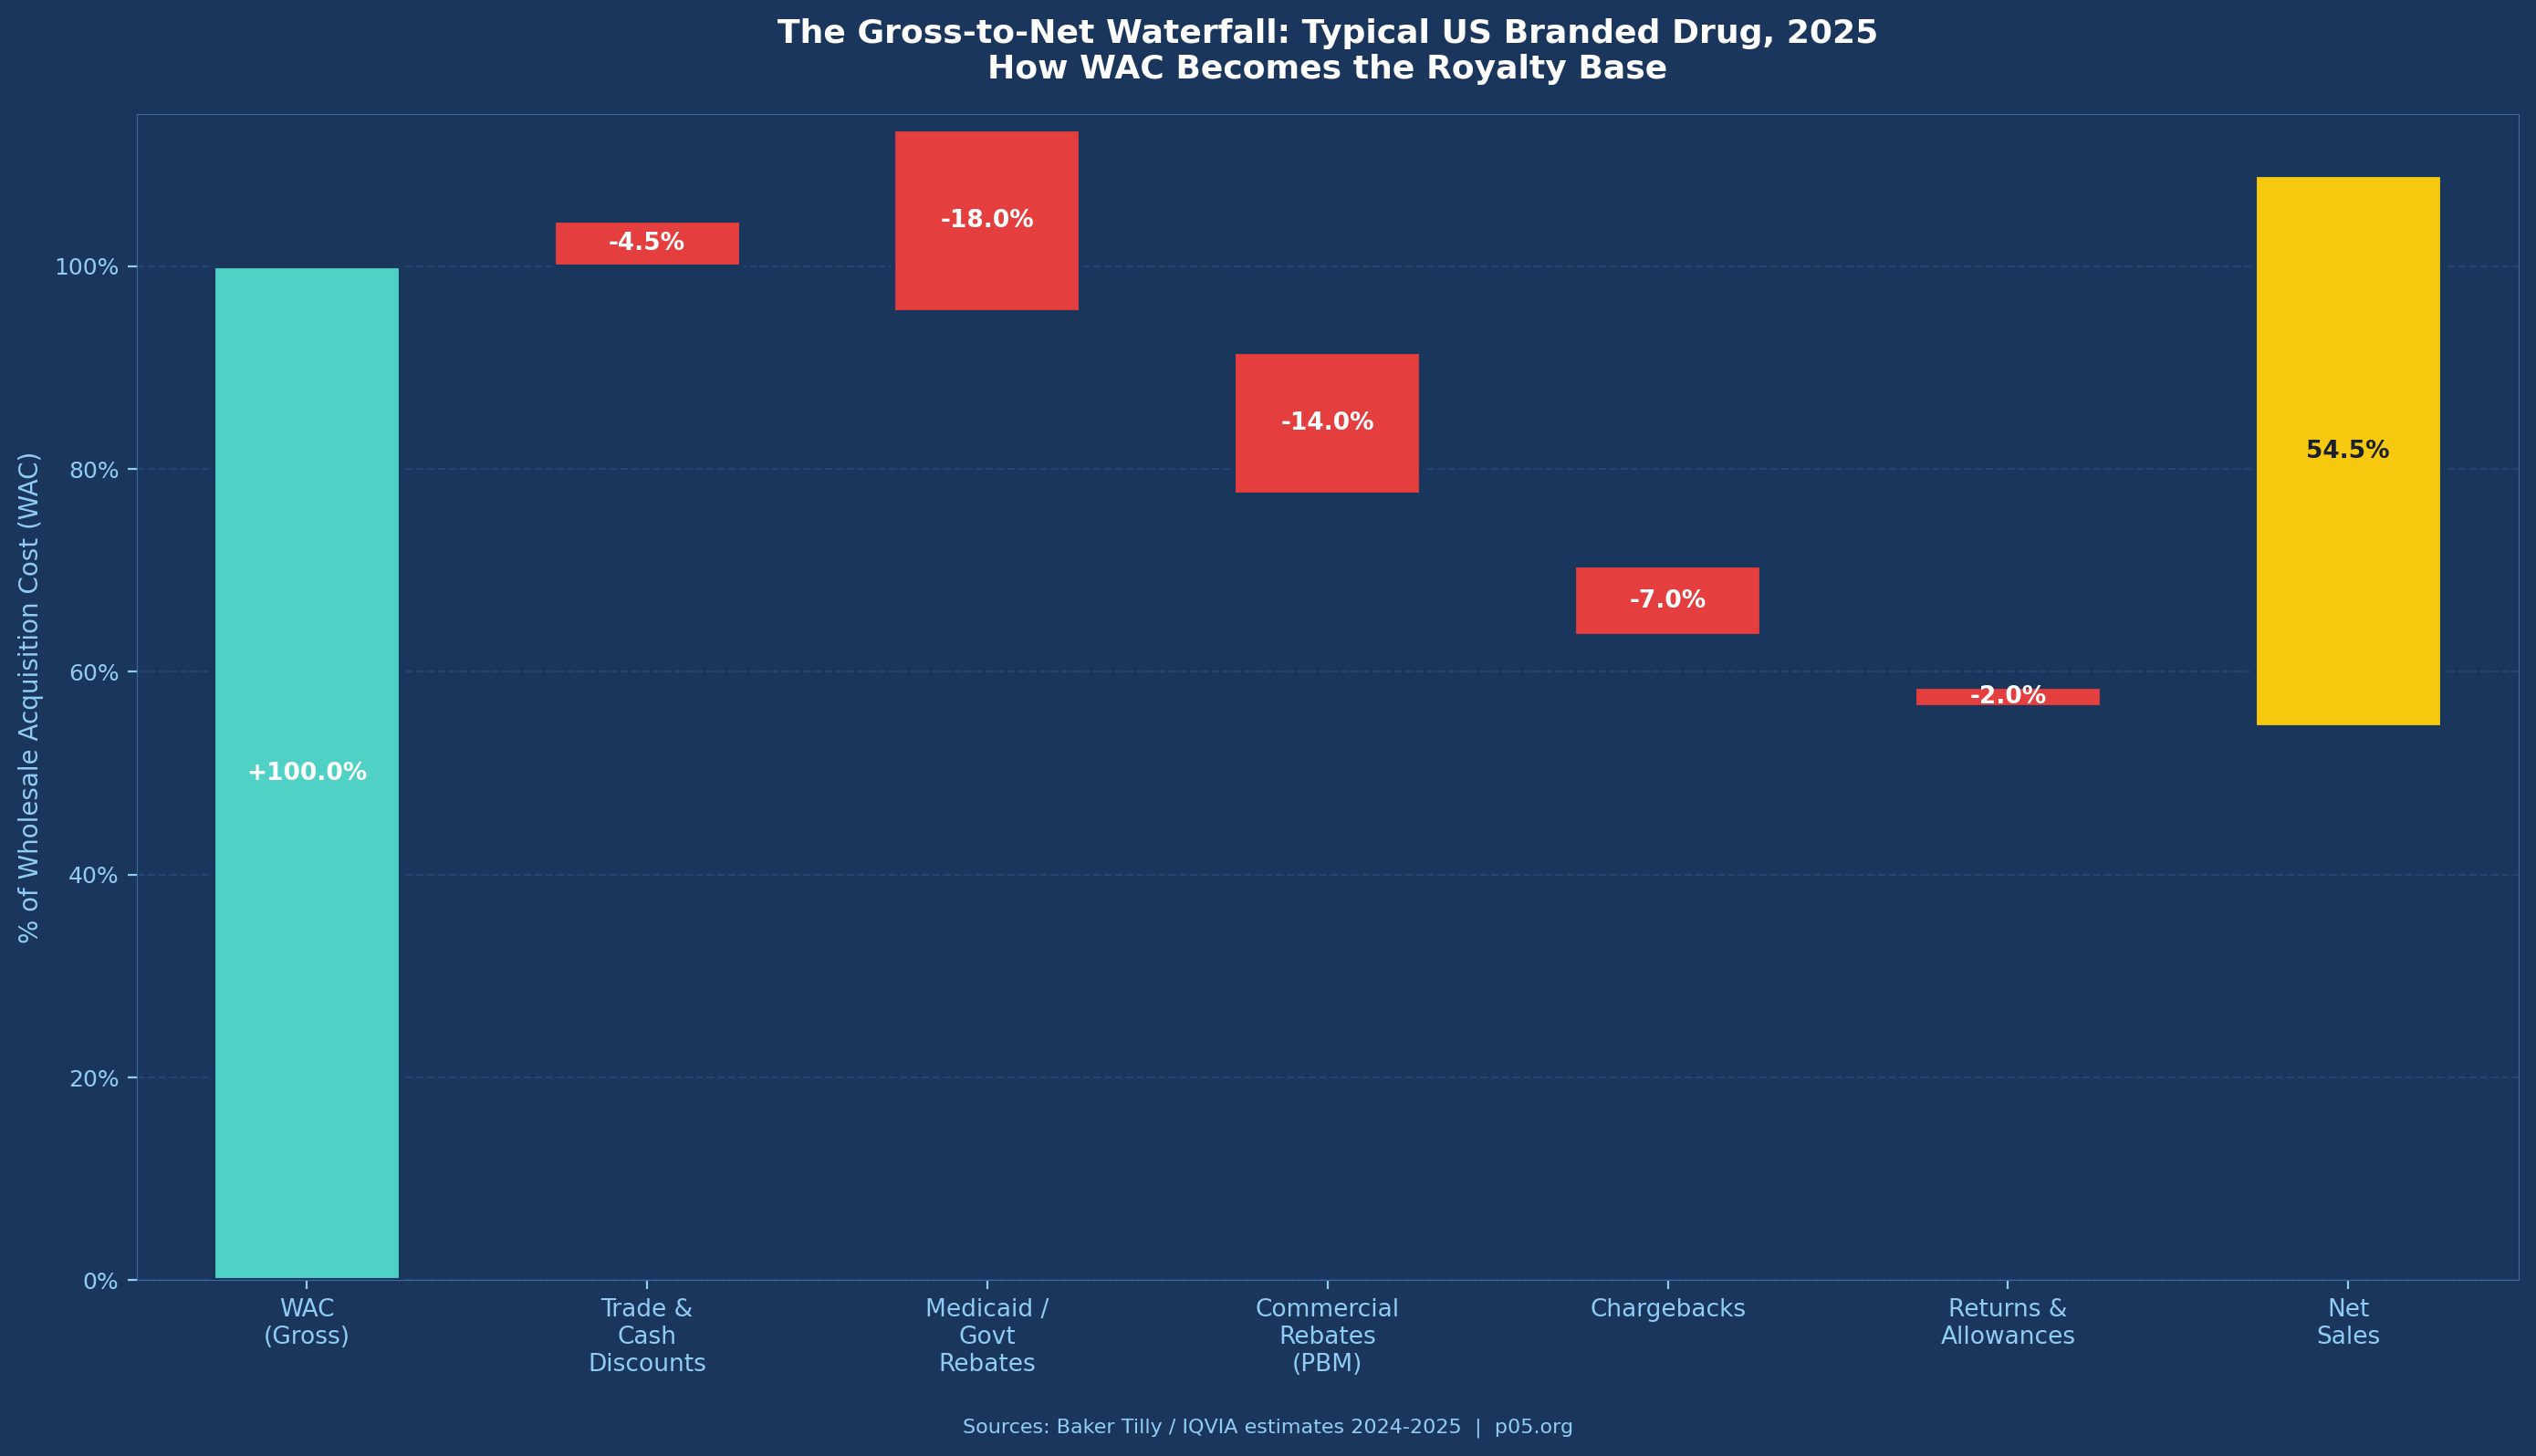
The net sales base appears clean until you examine what "net" actually means in contemporary US pharmaceutical markets. The gross-to-net discount — the percentage reduction from wholesale acquisition cost (WAC) to recognised net revenue — has expanded dramatically over the past decade and is accelerating under recent policy changes.
Baker Tilly's 2025 analysis of pharmaceutical GTN functions notes that pricing adjustments "can reduce [WAC] by as much as 70%." While that figure represents an extreme, average GTN discounts for branded drugs in 2024–2025 are estimated at 40–55% of WAC by IQVIA, up from roughly 30–35% a decade ago.
The components driving this widening are:
Medicaid rebates: Mandatory under the Omnibus Budget Reconciliation Act of 1990 (OBRA '90), codified at 42 U.S.C. § 1396r-8. The basic rebate is the greater of 23.1% of average manufacturer price (AMP) or the difference between AMP and best price. Increases above CPI trigger additional inflation rebates. Medicaid rebates are non-negotiable and cannot be contractually excluded from a net sales definition without creating a fictional royalty base disconnected from actual cash flows.
PBM and commercial rebates: The most opaque and fastest-growing deduction category. Rebates negotiated with pharmacy benefit managers to secure formulary position are now the dominant mechanism for payer access in the US market. These rebates are confidential, vary by contract, and are often back-loaded relative to actual sales. EisnerAmper's 2024 analysis estimates commercial rebates at 15–25% of WAC for branded products in competitive therapeutic classes.
Chargebacks: Wholesaler chargebacks occur when distributors sell to contract customers (hospitals, group purchasing organisations, federal facilities) at prices below their acquisition cost and are reimbursed by the manufacturer. The 340B Drug Pricing Programme, which requires manufacturers to provide discounts of roughly 25–50% below market to qualifying healthcare entities, generates substantial chargeback volumes through the contract pharmacy network.
The 340B complication: The 340B programme has become one of the most contested sources of GTN deductions. The programme has grown to cover more than 50,000 covered entities and 32,000 contract pharmacies. From a royalty perspective, the issue is that 340B discounts may or may not be included in the net sales definition depending on how the agreement is drafted — and their magnitude has increased substantially. In American Hospital Association et al. v. Kennedy (D. Me., Feb. 2026), a federal court vacated the 340B Rebate Model Pilot Programme, returning the programme to an upfront discount structure and maintaining the existing GTN impact on manufacturers.
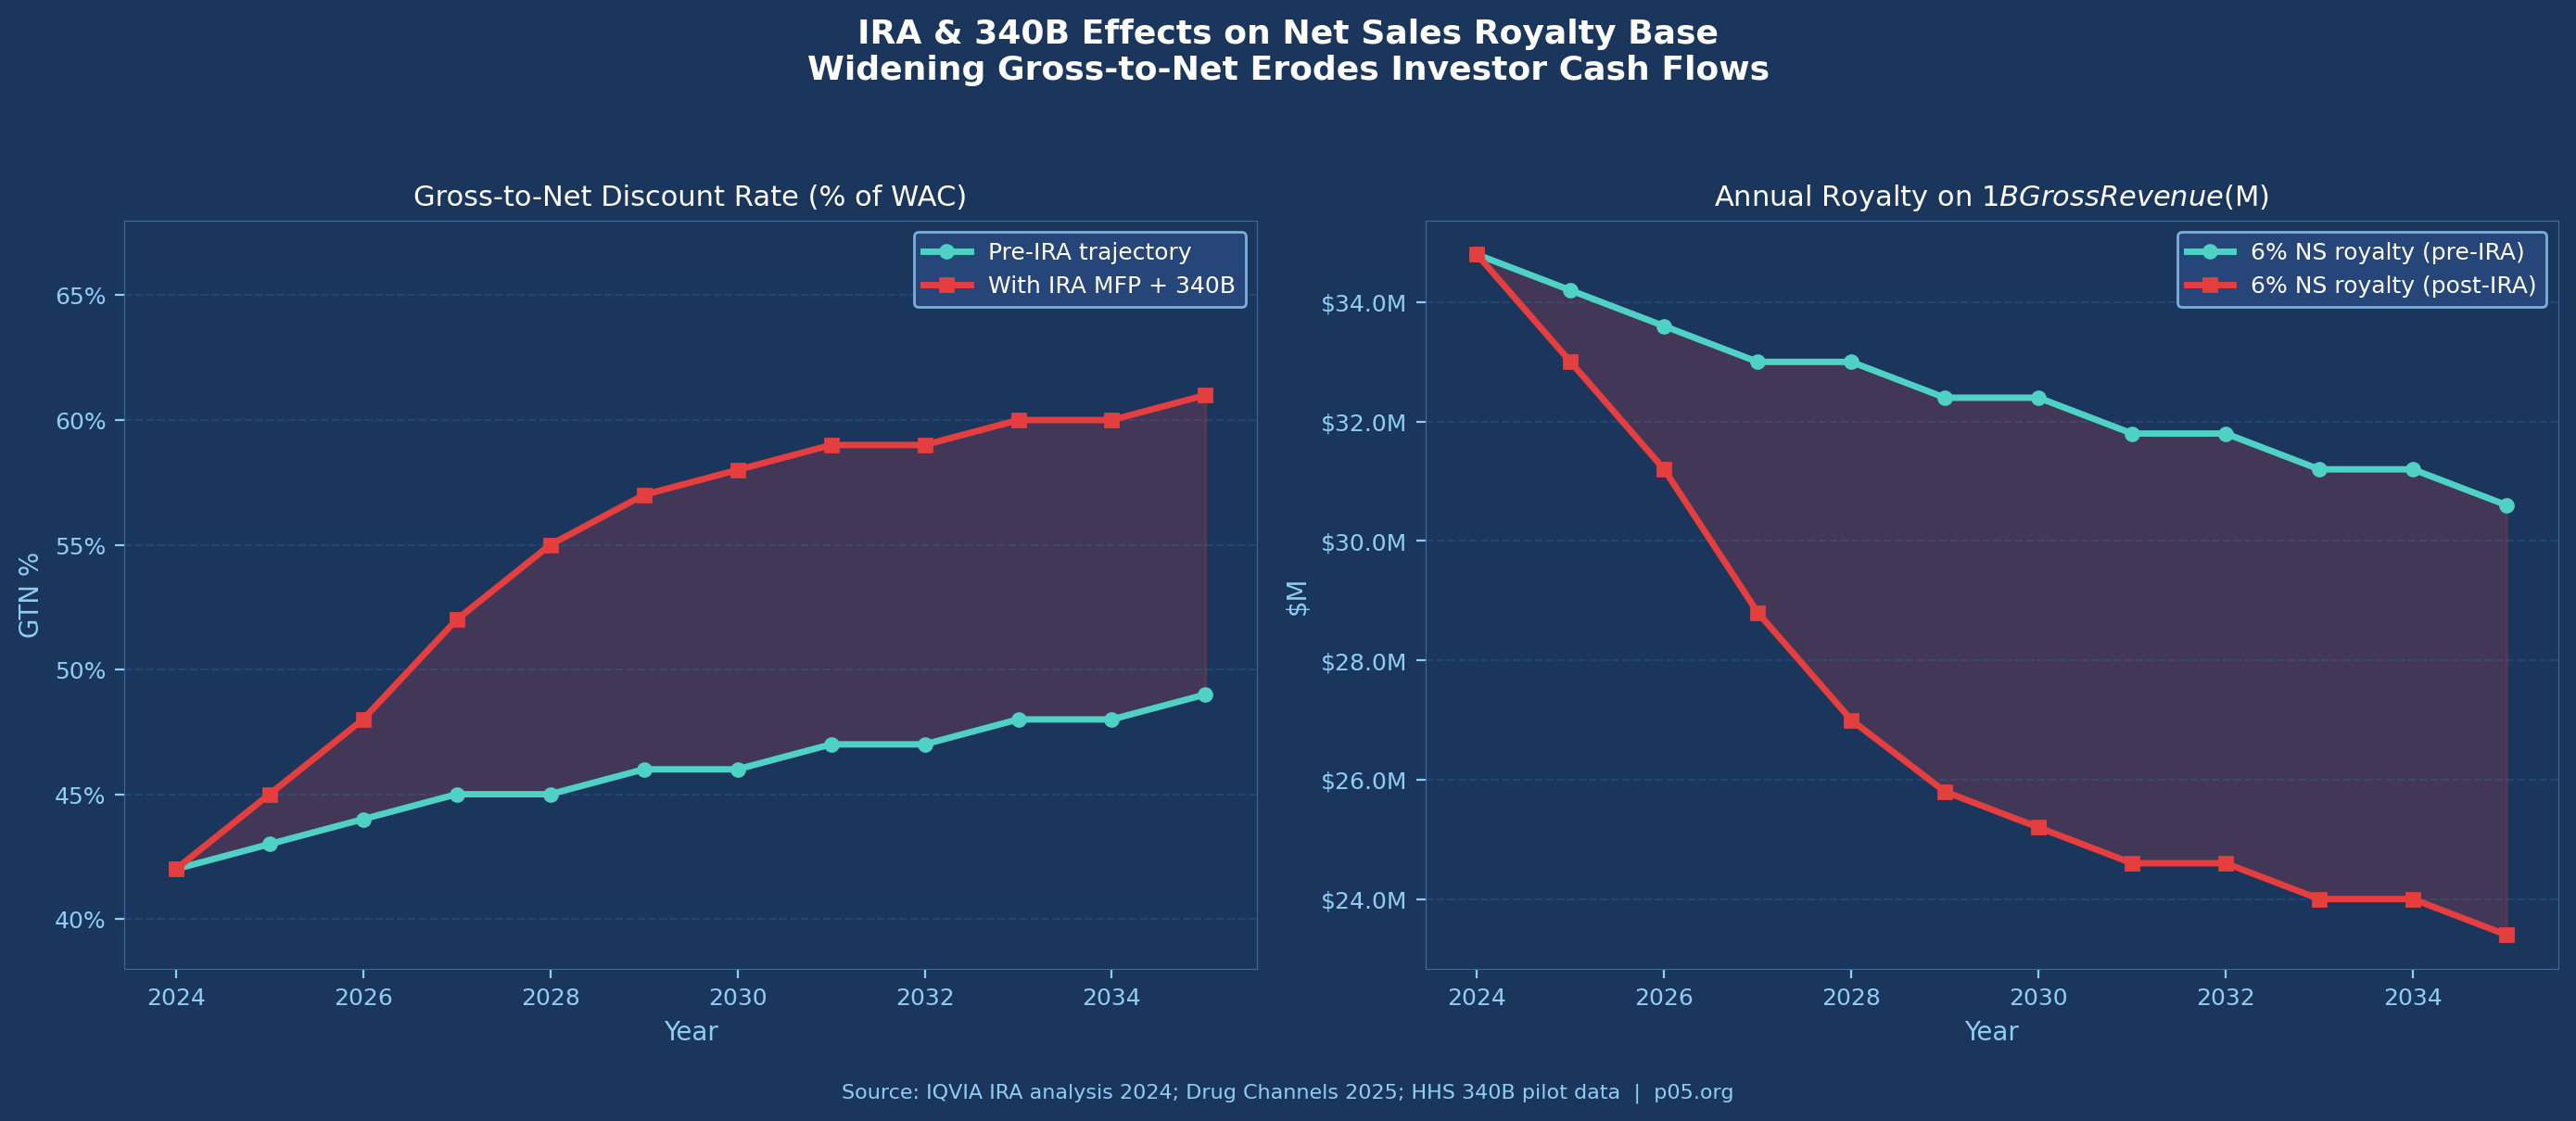
The IRA and Maximum Fair Price: The Inflation Reduction Act of 2022 introduced Medicare drug price negotiation, with the first cohort of Maximum Fair Prices taking effect in January 2026. As IQVIA's analysis notes, MFP negotiations "shorten a product's economic lifecycle by introducing a new Medicare event horizon at nine years for small molecule drugs and 13 years for large molecule drugs."
The interaction of MFP with 340B creates potential duplicate discount scenarios that remain legally contested as of March 2026. For royalty investors, the IRA's primary impact is through GTN widening: as manufacturer net prices are compressed, the gap between gross and net sales narrows the royalty base.
Part III: What Gets Negotiated and Why
The definition of net sales is not a standard-form provision. It is negotiated in every transaction, and sophisticated counterparties understand that the outcome of that negotiation determines the effective royalty rate more than the nominal percentage.
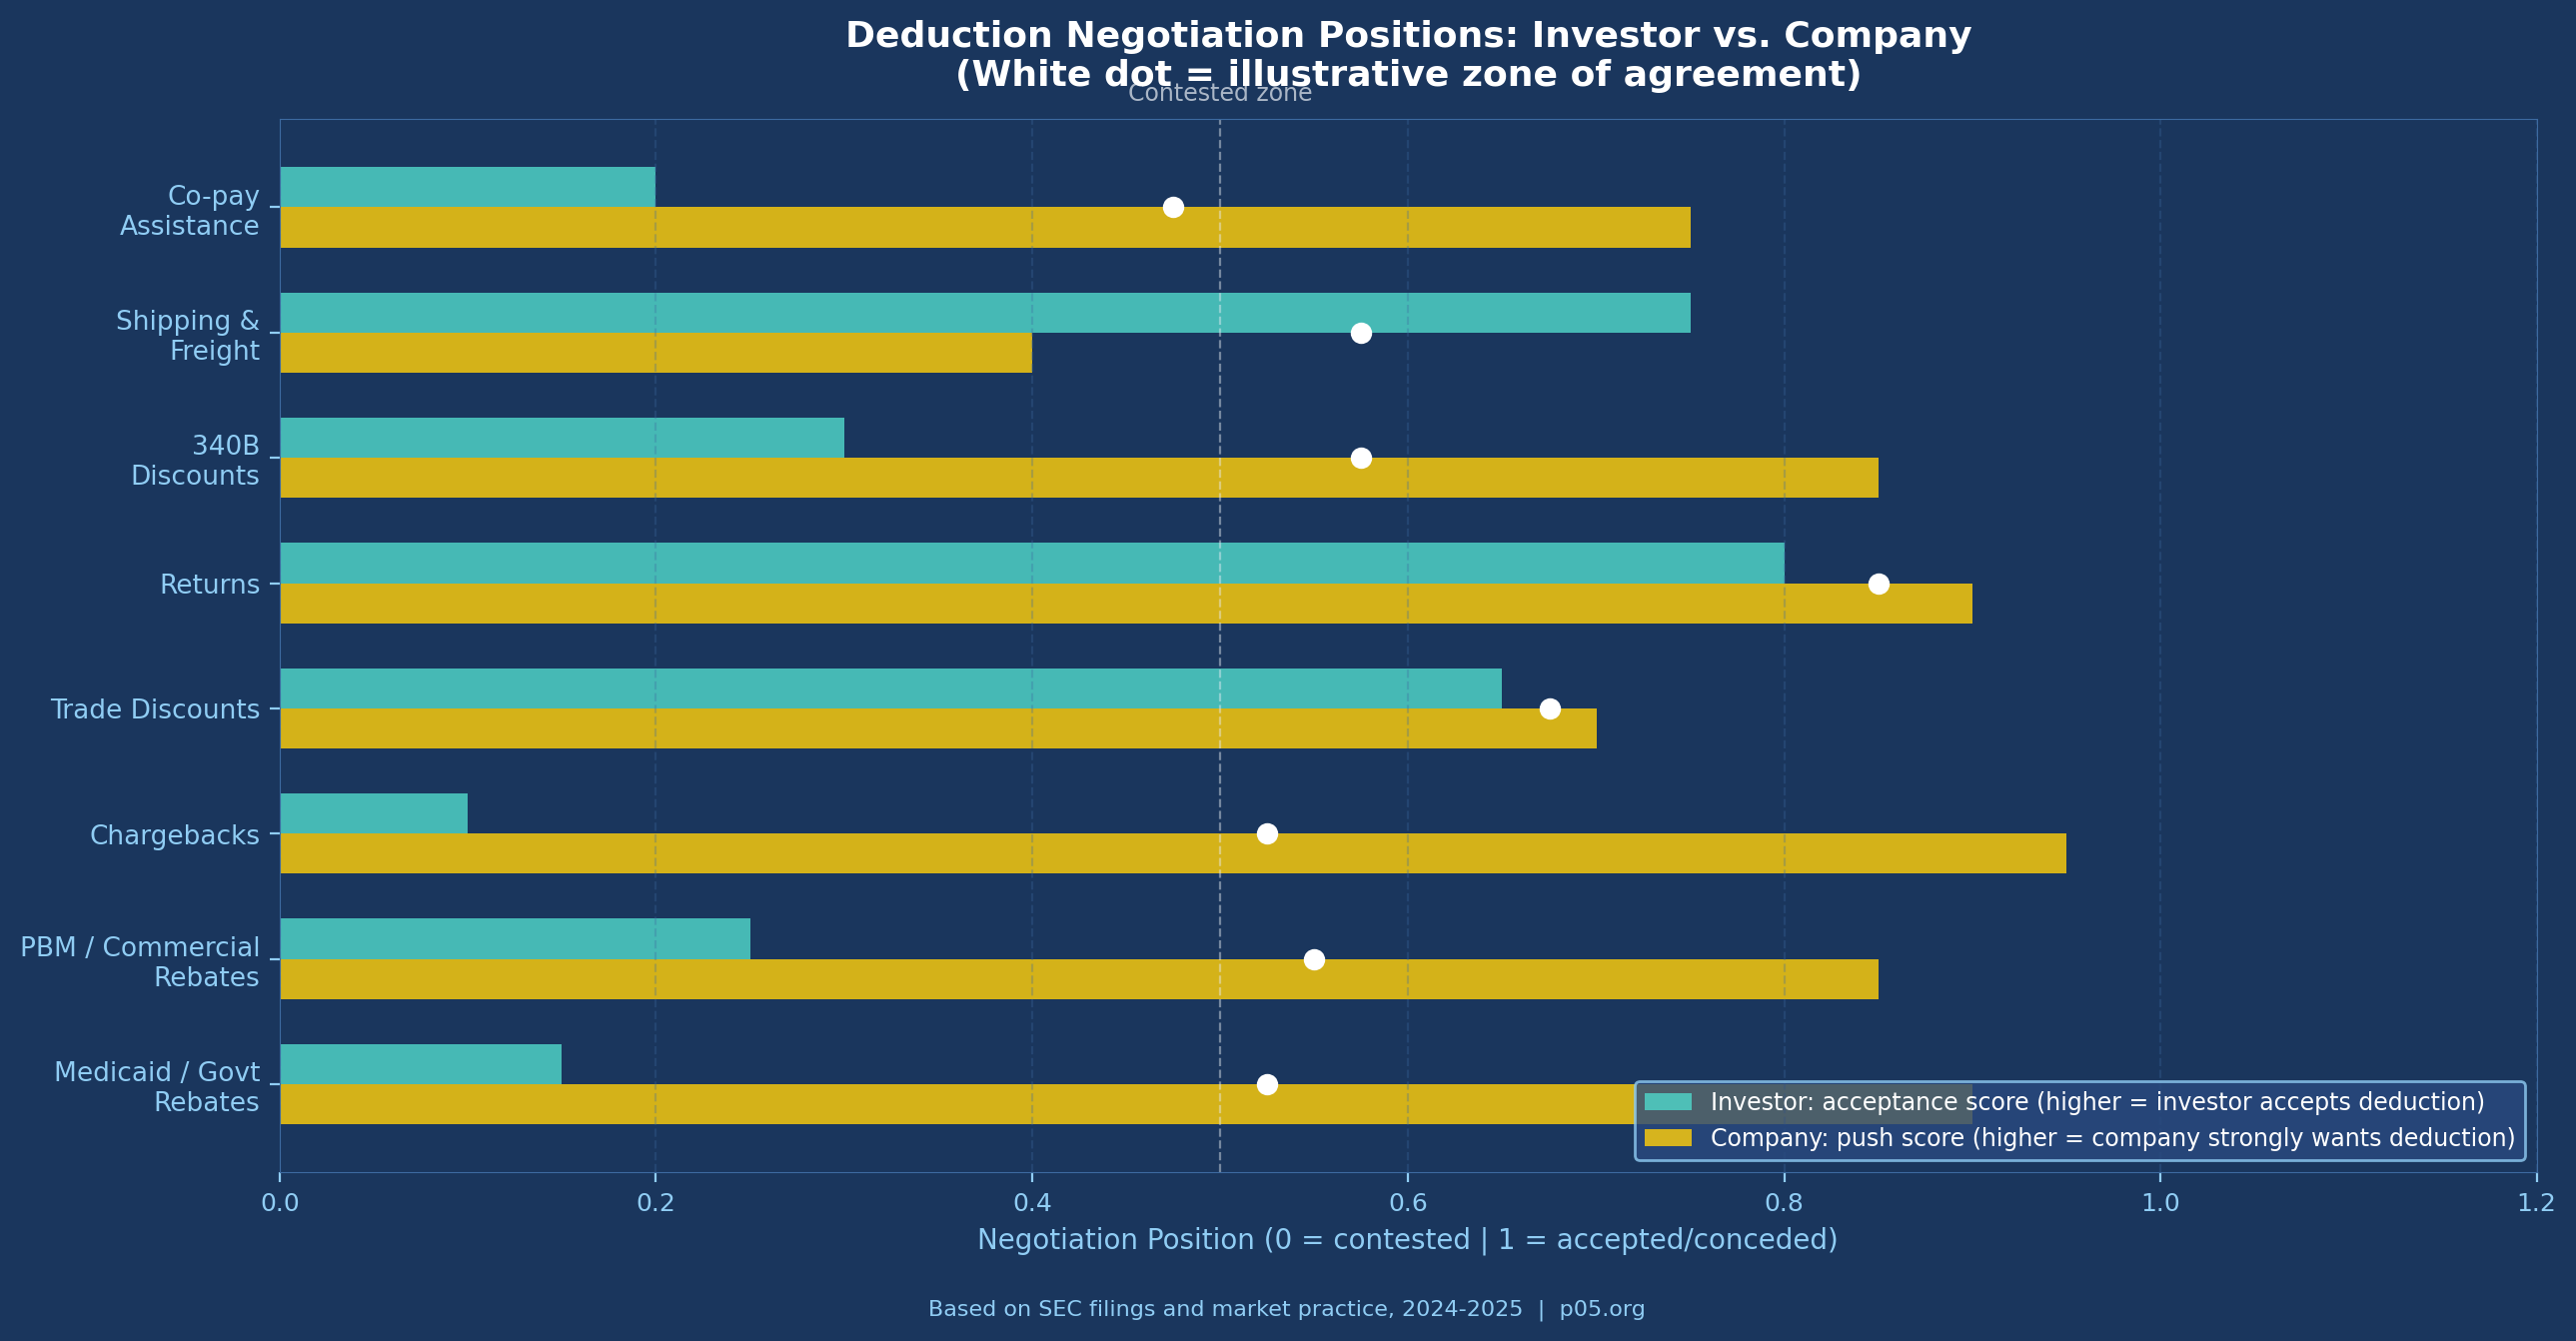
The following deductions are subject to active negotiation:
1. Co-Pay Assistance and Patient Support Programmes
Co-pay assistance programmes — where manufacturers subsidise patient out-of-pocket costs to improve adherence and access — are generally considered a commercial expense rather than a true sales deduction.
They do not reduce the amount received from third-party payers; they represent a manufacturer cost to maintain access. Most investor-side drafting excludes co-pay assistance from allowable deductions. Company-side counsel routinely attempts to include it, particularly for specialty products where co-pay liability can be significant.
The distinction matters financially. For an oncology product with 40,000 patients and average co-pay subsidies of $500 per month, co-pay programme costs can reach $240 million annually — a material deduction if allowed.
2. 340B Discounts
Whether 340B discounts should be deductible from net sales is genuinely contested. The argument for deductibility is that 340B prices represent actual cash received — the manufacturer does not collect WAC from a 340B-eligible transaction. The argument against is that 340B discounts are a government programme condition for Medicare participation, not a commercial concession, and that their treatment should follow ASC 606 rather than flow through to royalty calculations.
Sophisticated agreements increasingly specify whether 340B transactions are included or excluded from the royalty base, rather than leaving the question to accounting interpretation. Investors generally prefer inclusion (more volume, larger base); companies prefer exclusion (reduces base for a growing share of transactions).
3. Combination Product Allocations
When the royalty-bearing compound is sold as part of a combination product — a fixed-dose combination pill, a device-drug combination, or a co-packaged therapy — the agreement must specify how net sales of the combination are allocated to the royalty-bearing component. The standard approach is to calculate the fraction using the relative fair market value or wholesale acquisition cost of each component sold separately. If neither is sold separately, the parties are required to negotiate in good faith, with fallback to a third-party pricing expert.
The language in Epizyme/Eisai SEC filings illustrates the standard: "Net Sales for the purposes of determining royalty payments shall be calculated by multiplying the Net Sales of the Combination Product by the fraction [A/(A+B)] where A is the fair market value of the Licensed Product sold separately and B is the fair market value of all other pharmaceutical products included in the Combination Product." This appears clean but produces significant disputes when component products do not have independent market prices — which is increasingly common as novel combinations are designed from the outset.
4. Royalty Stacking Reductions
Pharmaceutical commercialisation requires licences from multiple parties. A company marketing a drug may owe royalties to the originating university, to a formulation IP holder, to a delivery device manufacturer, and to intermediate co-development partners simultaneously. When the aggregate royalty burden becomes commercially prohibitive, licensees seek royalty stacking reductions — contractual provisions allowing them to reduce the primary royalty by a fraction of royalties paid under ancillary licences.
Sills Cummis & Gross described the mechanics: the offset typically distinguishes between legally required licences (dominating patent rights) and elective improvement licences, with higher offsets permitted for the former. From the investor perspective, a royalty stacking clause is a deduction-through-the-back-door: it allows the royalty base (or effective rate) to be reduced by actions the company takes in its own commercial interest.
Standard protection language limits stacking reductions to a cap — typically no more than 50% reduction of the stated royalty rate — regardless of the volume of third-party royalties paid. Where a royalty stacking provision lacks a floor, a company with sufficiently complex licensing obligations can theoretically reduce its payment obligation to zero.
5. Deduction Caps
One of the most consequential protective mechanisms for investors is the aggregate deduction cap — a contractual limit on the percentage of gross sales that can be deducted in any royalty period. A typical formulation states that total deductions may not exceed a specified percentage (often 25–35%) of gross sales, regardless of how large individual deduction categories become.
As Nolo's licensing guide notes, some agreements bypass the itemisation entirely: "Net sales are gross sales minus X% for shipping, freight, taxes, returns, and other deductions." This eliminates accounting complexity but may understate or overstate actual deductions. The alternative — an itemised list with an aggregate cap — is preferred in institutional transactions because it preserves auditability while limiting downside.
Part IV: Relevant Law and Case Law
The Bayh-Dole Act Framework
For royalties arising from federally funded research, the Bayh-Dole Act (35 U.S.C. §§ 200–212) governs the licensing framework. Universities licensing inventions to commercial parties are required to share royalties with inventors and use remaining proceeds for education and research. The Act does not dictate the definition of the royalty base, but it creates a structure in which the university licensor has both contractual and regulatory incentives to audit royalty payments — making tight base definitions a practical necessity.
ASC 606 and Revenue Recognition
Under ASC 606 (Revenue from Contracts with Customers), manufacturers must estimate variable consideration — including rebates, chargebacks, and returns — at the point of sale. The standard requires recognition of the amount the entity expects to receive, net of estimated deductions.
This creates a situation in which the manufacturer's reported net sales, which is the figure most commonly used as the royalty base, is itself an estimate at the time of revenue recognition, subject to true-up over subsequent quarters.
For royalty investors, this means that reported net sales figures for any given quarter may change retroactively as actual chargeback settlements and rebate claims are processed. Agreements typically address this through quarterly reporting and an annual reconciliation mechanism.
Medicaid Rebate Litigation and Its Royalty Implications
The litigation history around the 340B programme and Medicaid rebates is extensive and directly affects royalty base calculations. In Astra USA, Inc. v. Santa Clara County, 563 U.S. 110 (2011), the Supreme Court held that there is no private right of action under the 340B statute, limiting enforcement to HRSA.
This is relevant to royalty disputes because it clarifies that covered entities cannot independently enforce their 340B pricing rights against manufacturers — and by extension, manufacturers have somewhat more flexibility in how they structure 340B discount mechanisms, with implications for how those discounts flow through net sales definitions.
In American Hospital Association et al. v. Kennedy (D. Me., Feb. 10, 2026), the District of Maine vacated the 340B Rebate Model Pilot Programme, which had been designed to allow manufacturers to offer 340B discounts as back-end rebates rather than upfront discounts. The court's ruling preserved the upfront discount structure, which means 340B discounts continue to flow through the existing GTN mechanism — relevant to any royalty agreement that does or does not specify 340B treatment.
The 25 Percent Rule and Its Rejection
The "25 percent rule of thumb" — the notion that a licensor should receive approximately 25% of the licensee's anticipated operating profit — was the dominant framework for royalty rate setting for decades. It was effectively invalidated as an expert methodology by the Federal Circuit in Uniloc USA, Inc. v. Microsoft Corp., 632 F.3d 1292 (Fed. Cir. 2011), which held that the rule was "fundamentally flawed" and should not be presented to juries without evidence of its application to the specific facts at issue.
While Uniloc addressed patent infringement damages rather than contractual royalties, it has influenced how practitioners approach rate setting and reinforced the primacy of deal-specific negotiation over industry rule-of-thumb approaches.
The Journal of Commercial Biotechnology's analysis of 458 pharmaceutical licence agreements found that the 25% rule had "little if any evidence of its use" in practice and that the data did not support its use even as a starting point for negotiation. The upshot for base negotiations: the rate and the base are co-determined, and any analysis that focuses on one in isolation of the other produces unreliable outputs.
Part V: The IRA's Structural Effect on Royalty Base Negotiations
The Inflation Reduction Act has introduced a new and poorly-understood source of royalty base uncertainty: the relationship between Maximum Fair Price negotiations and existing contractual net sales definitions.
When the US government negotiates an MFP for a product, it is setting the price at which Medicare Part D plans can acquire the drug. For the first ten products subject to MFP negotiations (effective January 2026), this represents a price cut of an average of 56.5% versus prior negotiated prices, according to CMS data. For royalty investors holding interests in those products, the question is whether MFP negotiations affect the net sales base.
The answer depends on how the agreement defines net sales. If net sales equals net revenue as reported under ASC 606, and if ASC 606 net revenue reflects the MFP as the transaction price in the Medicare channel, then MFP reduces the royalty base directly.
If the agreement defines net sales as gross amounts invoiced, less enumerated deductions, and MFP does not trigger any of the enumerated deductions (because it operates through a statutory price rather than a rebate), then the base may be unaffected — or more accurately, the treatment is unclear and likely to be disputed.
IQVIA's analysis identifies MFP as a "new Loss of Exclusivity event" for royalty economics. From a royalty-base perspective, the mechanism is subtler: it is not that the product loses exclusivity, but that the effective price in one channel is mandatorily compressed, reducing net sales without a corresponding reduction in volume. For royalty agreements executed before the IRA's passage (2022), this scenario was not contemplated in the drafting — creating ambiguity that will be resolved by negotiation or litigation.
Practical consequence: new agreements executed from 2024 onward should specify explicitly whether MFP discounts constitute allowable deductions from gross sales in computing net sales. Investors should resist their inclusion absent a corresponding rate adjustment.
Part VI: How Sophisticated Parties Negotiate the Base
The negotiation of net sales definitions in institutional pharmaceutical royalty transactions follows a predictable structure, with a set of non-negotiable investor positions and a set of issues where outcome depends on leverage.
Investor non-negotiables in 2025–2026 practice:
Established royalty investors — Royalty Pharma, HealthCare Royalty, Blackstone Life Sciences, and their peer group — uniformly require that the royalty base be commercially reported net sales for US transactions, reconcilable to the company's financial statements. This is not a courtesy; it reflects the investor's portfolio-management reality: hundreds of royalty interests cannot be individually audited for bespoke expense allocations. The Royalty Pharma / Revolution Medicines 8-K filed in June 2025, for example, defines the royalty as applying to "worldwide annual net sales" without further qualification — language that implicitly ties payments to ASC 606-reported revenues.
Similarly, Royalty Pharma's acquisition of the Imdelltra royalty from BeOne Medicines for up to $950 million — structured as approximately 7% on worldwide net sales — uses the unmodified net sales definition because Amgen's financial statements provide an auditable benchmark.
Areas of active negotiation:
Deduction caps: Investors strongly prefer aggregate caps of 20–30% of gross sales. Companies prefer uncapped deductions, arguing that Medicaid and commercial rebate obligations are outside their control. The resolution typically lands at a cap of 25–35%, with carve-outs for extraordinary government pricing programmes.
Co-pay assistance: As noted above, the investor position is exclusion; the company position is inclusion. Most deals executed between institutional investors and commercial-stage biotechs exclude co-pay assistance from net sales deductions.
Combination products: Agreements increasingly specify the allocation methodology upfront rather than deferring to good-faith negotiation — the latter being a litigation invitation. The preferred approach is a fixed fraction based on an agreed independent valuation, with a third-party expert fallback.
Royalty stacking floors: Investors insist on a minimum royalty floor that cannot be reduced below a stated percentage regardless of stacking offsets. A typical floor is 50% of the stated rate.
Generic competition reductions: Standard in academic licences, less common in institutional royalty transactions, but present in some agreements as a mechanism to reduce the royalty rate (not the base) when generic or biosimilar entry erodes market share. These are rate adjustments, not base adjustments, but operate similarly in cash-flow terms.
What AUTM survey data says about university practice:
The AUTM annual survey provides the most comprehensive data on royalty practice in academic licences. Running royalty rates in pharmaceutical agreements average 3–7% for licensed inventions, with rates varying significantly by stage and exclusivity scope. AUTM data does not disaggregate by base definition, but the standard university licence agreement — exemplified by the KU Center for Technology Commercialization/Reata Pharmaceuticals agreement — uses net sales as defined by GAAP with enumerated standard deductions.
Part VII: A Worked Example
To illustrate the stakes, consider a US-marketed oncology product with the following characteristics:
- WAC: $120,000 per year (consistent with CAR-T or high-value targeted therapy pricing)
- Patient volume: 8,000 treated annually
- Gross revenue: ~$960 million
Under a standard GTN schedule for a specialty oncology product in 2025:
| Deduction Category | % of WAC | $ per Year ($M) |
|---|---|---|
| Trade/cash discounts | 3% | $29M |
| Medicaid government rebates | 15% | $144M |
| Commercial/PBM rebates | 18% | $173M |
| Chargebacks (incl. 340B) | 8% | $77M |
| Returns and allowances | 1.5% | $14M |
| Total deductions | 45.5% | $437M |
| Net Sales | 54.5% of WAC | ~$523M |
A 6% net sales royalty generates $31.4M annually at this level. A 20% net profits royalty, assuming operating margins of 40% on net sales ($209M operating profit) generates $41.8M. The net profits royalty appears more valuable — but that margin assumption is generous and volatile. In the product's first two years, with $150M+ in launch spending, operating profit is likely negative. The net sales royalty pays through year one; the net profits royalty does not.
Now consider the IRA impact on this product from year 9 forward, when Medicare MFP negotiations could reduce the effective price in the Medicare channel by 40–55%. If net sales falls to 35% of WAC in the Medicare-affected book of business (roughly 40% of volume for a Medicare Part D–relevant oncology product), aggregate net sales fall from $523M to approximately $430M. The 6% royalty declines from $31.4M to $25.8M annually — a 17.7% reduction with no change in gross volume.
That reduction is not hypothetical. It is the structural trajectory for any product entering the MFP negotiation window, and it illustrates why base definitions executed before 2022 may require renegotiation.
Practical Implications
For companies seeking royalty financing: The rate headline in your term sheet is less important than the deduction schedule. A 6% royalty with broad deductions and no cap can deliver lower investor returns than a 4% royalty with a 30% deduction cap — which means the investor will price the former more expensively on risk-adjusted terms. Understanding what your GTN profile looks like over the product lifecycle, and being transparent about it, enables the investor to price correctly and reduces the probability of a mid-agreement dispute.
For investors underwriting net sales royalties: The GTN assumption embedded in your model deserves the same rigour as your revenue forecast.
A product entering a competitive therapeutic class with strong PBM rebate requirements, meaningful Medicaid exposure, and IRA vulnerability has a structurally different royalty base profile than a product in a low-rebate, low-Medicaid market. Applying a uniform GTN assumption across your portfolio — or accepting the company's projected net sales without stress-testing the deduction schedule — creates silent basis risk that materialises when the product succeeds commercially.
For acquirers inheriting royalty agreements: When a pharmaceutical company acquisition brings royalty obligations, the acquirer must understand how the target's GTN practice affects the royalty base. A licensor who negotiated their agreement when Medicaid rebates were 15% of WAC, and whose agreement uses ASC 606 net sales as the base, will see their royalty receipts decline as GTN widens — without any renegotiation required. That dynamic should be modelled in deal-specific scenarios, not proxied from generic royalty data.
Conclusion
The pharmaceutical royalty market — which Gibson Dunn documented at $29.4 billion in transactions from 2020 to 2024 — has grown into one of the most sophisticated segments of healthcare finance. Royalty Pharma alone deployed $2.8 billion of capital in 2024 and reported $3.25 billion in Portfolio Receipts for full year 2025, a 16% increase, suggesting that at the current scale of the market, even a 2–3 percentage point shift in the effective royalty base translates into hundreds of millions of dollars annually across the industry.
The rate conversation happens in every term sheet. The base conversation happens in drafting — quietly, with less fanfare, but with far greater consequence. A royalty on net profits is a royalty on hope: it pays only when commercial execution, expense allocation, and accounting choices all align in the investor's favour simultaneously. A royalty on net sales, well-defined and with appropriate caps, is a royalty on revenue — auditable, predictable, and structurally senior to the company's ability to manage costs.
As the Covington & Burling overview noted in May 2025, the royalty financing market has matured to the point where structuring sophistication is now a competitive differentiator for investors. That sophistication starts with the base.
The next time someone presents a royalty deal and leads with the rate, ask to see the net sales definition first.
This analysis references publicly available materials including SEC filings. All information was accurate as of March 2026 and is derived from publicly available sources. This content is for informational purposes only and does not constitute investment, legal, or financial advice. The author is not a lawyer or financial adviser, and nothing herein should be construed as legal or investment guidance.