The CFO's Complete Guide to Pharmaceutical Royalty Financing: From Preclinical to Commercial

A stage-by-stage decision framework for evaluating synthetic royalties, royalty monetization, and alternatives in the $29 billion royalty financing market
Pharmaceutical royalty financing has transformed from a niche instrument into a $29.4 billion market (2020–2024), more than double the preceding five years. But the critical question isn't whether royalty capital is available—it's whether accepting it creates or destroys shareholder value at your specific development stage.

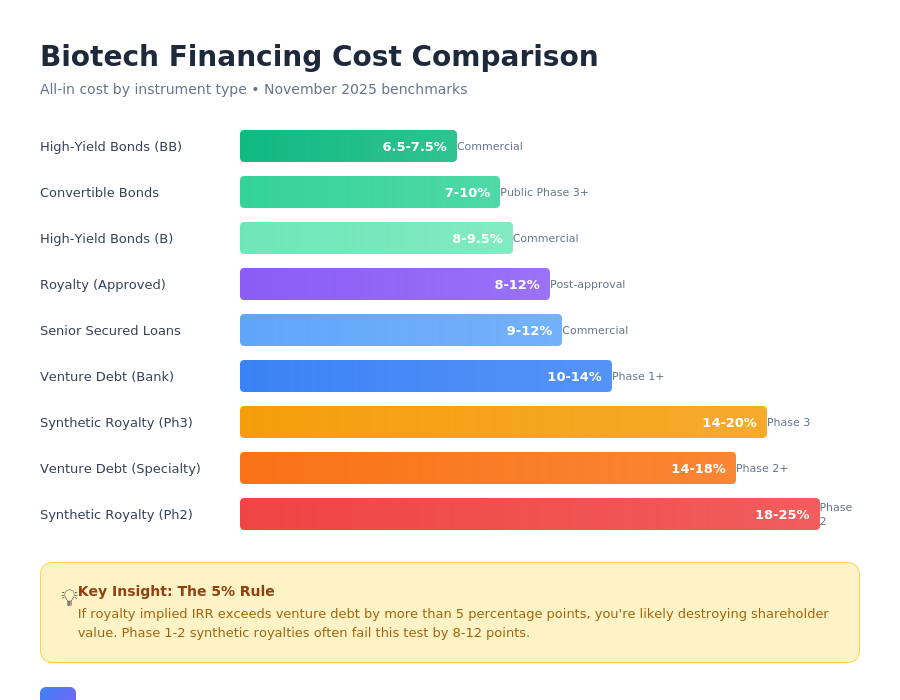
The math is unforgiving. When Royalty Pharma targets mid-teens IRRs on development-stage assets and achieves 15.7% ROIC across their portfolio, companies are paying venture-capital returns for what functions as debt. Meanwhile, venture debt costs 8–15%, senior secured loans run 9–12%, and high-yield bonds price at 6.5–10% for those who can access them.
This guide breaks down exactly when royalty financing is optimal, when it's acceptable, and when it becomes the most expensive capital mistake a CFO can make—including when it poisons future M&A prospects entirely.
Understanding the Royalty Financing Landscape
Before diving into stage-by-stage analysis, understanding the fundamental distinction between royalty transaction types is essential. These are not interchangeable financing tools—they serve different companies at different stages with dramatically different risk-return profiles.
| Transaction Type | Definition | Availability | Primary Use Case |
|---|---|---|---|
| Synthetic Royalty | Company creates a NEW revenue-sharing obligation on a product it will commercialize | Pre-approval (Phase 2–3) or early commercial | Clinical-stage funding, launch capital |
| Royalty Monetization | Company sells an EXISTING royalty stream it receives from licensing IP | Post-approval | Converting partner royalties to upfront cash |
| Revenue Interest | Hybrid with milestones + royalties | Any stage with revenue visibility | Flexible capital across development |
Per Gibson Dunn, synthetic royalties are structured under Article 9 of the UCC as "an account"—the right to payments arising from future sales that don't yet exist. This makes synthetic royalties inherently a pre-approval or early-commercial instrument.
A Covington study of 39 deals (2019–2023) found that 95% of royalty monetizations were structured as true sales with no fixed repayment obligation. These deals featured remarkably light covenants: only 54% had limitations on liens, 5% on additional debt, and 0% included financial covenants. The median capped return was 2.25x with a range of 1.3x to 3.4x.
The Market Benchmark: How Royalty Pharma Sets Pricing
Royalty Pharma commands approximately 58% market share of royalty acquisitions (2012–2023), making its return targets the de facto market standard. Understanding these benchmarks is essential for negotiating favorable terms.
Royalty Pharma's Q3 2025 portfolio composition reveals a business heavily weighted toward commercial assets: 86% of invested capital sits in approved products (including 19% that were development-stage at acquisition), with only 11% remaining in development-stage therapies. Since 2012, approximately 65% of capital deployed has targeted approved products.
Return Targets by Approval Status
| Asset Stage | Royalty Pharma Target IRR | Typical Cap Multiple |
|---|---|---|
| Approved Products | 8–12% (high-single to low-double digit) | 1.3x – 2.0x |
| Development-Stage (Phase 3) | Mid-teens | 1.65x – 2.35x |
| Development-Stage (Earlier) | High-teens to 20%+ | 2.0x – 3.0x |
Actual performance has exceeded these targets. Royalty Pharma reports a 15.7% return on invested capital (LTM Q3 2025), with over 90% of transactions since 2020 exceeding the company's approximately 7% cost of capital.
Current Market Conditions: November 2025 Baseline
Before evaluating royalties, CFOs need current capital market benchmarks.
Reference Rates
| Benchmark | Current Level | Implication |
|---|---|---|
| Fed Funds Rate | 3.75–4.00% | Declining from peak |
| SOFR (Overnight) | ~4.05% | Floating debt benchmark |
| 10-Year Treasury | ~4.14% | Long-term credit pricing |
| Fed 2026 Projection | 3.4% | Expected continued easing |
Biotech Equity Market Conditions
| Metric | Current Status | Implication |
|---|---|---|
| XBI Index | ~$122 (+22% YTD) | Secondary market improved |
| IBB Index | ~$174 (+18.5% YTD) | Large-cap biotech strong |
| Biotech IPOs (2025) | ~10–12 | Down from 25 in 2024 |
| Follow-on discount | 50%+ avg vs. offer | Dilutive equity expensive |
The Paradox: Biotech indices are near 52-week highs, yet the IPO window remains effectively closed and follow-ons trade at massive discounts. This creates conditions where royalty providers extract maximum value—companies need capital but can't access public equity at fair prices.
Stage-by-Stage Decision Framework
Cost of Capital and Financing Access by Stage
| Development Stage | WACC Range | NPV Discount Rate | Debt Access | Synthetic Royalty Access | Equity Dilution |
|---|---|---|---|---|---|
| Preclinical | 15–18% | 40–50% | None | None | 25–35% |
| Phase 1 | 14–17% | 30–40% | Limited VD | Rare/Punitive | 20–30% |
| Phase 2 | 12–15% | 25–35% | Moderate VD | Emerging | 15–25% |
| Phase 3 | 10–13% | 18–25% | Good VD/Converts | Prime Market | 12–20% |
| Commercial | 8–11% | 12–18% | Full Debt Menu | N/A (use debt) | 8–15% |
Preclinical: Royalties Not Available—Equity Is Your Only Option
Financing reality: Royalty investors won't touch preclinical assets. The risk is too high, the timeline too long, and the valuation too uncertain.
Venture debt access: Generally unavailable for single-asset preclinical companies. Lenders like Hercules Capital require clinical data or platform technology.
| Preclinical Decision | Recommendation |
|---|---|
| Best option | Series Seed/A equity |
| Alternative | Platform-based venture debt (rare) |
| Synthetic royalty | Not available |
| Key trade-off | Accept 25–35% dilution or don't advance |
CFO Verdict: No royalty decision to make. Focus on minimizing equity dilution through efficient capital raises.
Phase 1: Venture Debt Usually Beats Emerging Royalty Options
Financing reality: Synthetic royalty financing begins to emerge for exceptionally validated Phase 1 assets, but terms are punitive—implied IRRs of 25%+ reflecting near-complete clinical risk.
| Phase 1 Option | Cost | Availability | Recommendation |
|---|---|---|---|
| Series B Equity | 25–35% dilution | Broadly available | Acceptable if terms fair |
| Venture Debt (Bank) | 10–13% + warrants | With strong VC backing | Preferred if accessible |
| Venture Debt (Specialty) | 14–18% + warrants | Moderate availability | Secondary option |
| Synthetic Royalty | 25%+ implied IRR | Rare, exceptional assets | Avoid—too expensive |
Why royalties are suboptimal at Phase 1:
- Implied IRR of 25%+ exceeds venture debt by 10+ percentage points
- Variable payments mean blockbuster success generates massive royalty burden
- Better to accept 10–15% warrant dilution than 25%+ IRR equivalent
CFO Verdict: If you can access venture debt at 12–15% all-in, take it over royalty financing. The cost differential is too large.
Phase 2: The Inflection Point—Careful Analysis Required
Financing reality: This is where synthetic royalty financing becomes genuinely available but requires rigorous analysis. Phase 2 data de-risks assets enough for royalty buyers to underwrite, but implied IRRs remain elevated at 18–25%.
Recent Phase 2-Stage Deal Benchmarks
| Company | Upfront | Structure | Implied IRR Range |
|---|---|---|---|
| Heidelberg Pharma / HCRx | $115M | Tiered royalty | Est. 18–22% |
| Sutro / Blackstone | $140M | 4% on partner products | Est. 15–20% |
The Critical Comparison at Phase 2
| Financing Option | All-In Cost | Phase 2 WACC (12–15%) | Spread vs. WACC |
|---|---|---|---|
| Venture Debt | 12–16% | 12–15% | 0 to +3% |
| Convertibles (if public) | 8–12% | 12–15% | -4 to 0% |
| Synthetic Royalty | 18–25% | 12–15% | +5 to +12% |
| Series C Equity | 18–25% dilution | 12–15% | +5 to +12% |
When royalties make sense at Phase 2:
- Venture debt unavailable (weak VC backing, single asset, limited runway)
- Equity markets closed or severely discounted
- Asset has clear blockbuster potential justifying premium capital cost
- Structure includes tight cap (≤2.0x) protecting upside
When royalties are expensive debt at Phase 2:
- Venture debt accessible at 12–16%
- Convertible market open for public companies
- Royalty structure lacks protective cap
- Implied IRR exceeds 20%
CFO Verdict: Phase 2 is context-dependent. Model the specific deal terms against venture debt alternatives. If the spread between royalty implied IRR and venture debt exceeds 5 percentage points, royalties are likely destroying value.
Phase 3: The Prime Market for Synthetic Royalties—But Discipline Required
Financing reality: Phase 3 is the sweet spot for synthetic royalty financing. Risk has declined substantially, revenue visibility has improved, and royalty buyers compete for deals. But this doesn't mean all deals are well-priced.
Recent Phase 3 / Near-Approval Deal Benchmarks
| Company | Asset | Upfront | Royalty Rate | Cap / Structure | Verdict |
|---|---|---|---|---|---|
| Revolution Medicines | RAS(ON) inhibitors | $2B total | 7.8% → 0% tiered | 0% above $8B sales | Best-in-class |
| Cytokinetics | Aficamten | $575M | 4.5% up to $5B | 1.9x on funding | M&A warning |
| Syndax / Royalty Pharma | Niktimvo | $350M | 13.8% U.S. net sales | 2.35x cap | Expensive |
| Geron / Royalty Pharma | RYTELO | $125M | 7.75%/3%/1% tiered | 1.65x–2.0x | Well-structured |
| Ascendis / Royalty Pharma | Yorvipath | $150M | 3% U.S. net sales | 1.65x–2.0x | Well-structured |
Implied IRR Analysis by Return Cap
| Deal Structure | If Cap Hit in 5 Years | If Cap Hit in 8 Years | If Cap Hit in 12 Years |
|---|---|---|---|
| 1.5x cap | 8.4% IRR | 5.2% IRR | 3.4% IRR |
| 1.65x cap | 10.5% IRR | 6.4% IRR | 4.2% IRR |
| 1.9x cap | 13.7% IRR | 8.4% IRR | 5.5% IRR |
| 2.35x cap | 18.6% IRR | 11.2% IRR | 7.3% IRR |
| 3.0x cap | 24.6% IRR | 14.7% IRR | 9.6% IRR |
The Phase 3 Comparison Matrix
| Financing Option | All-In Cost | Phase 3 WACC (10–13%) | Optimal Scenario |
|---|---|---|---|
| Venture Debt | 9–13% | 10–13% | High conviction, debt capacity |
| Convertibles | 7–10% effective | 10–13% | Public company, stock upside |
| Senior Secured | 9–12% | 10–13% | Near-approval, revenue visibility |
| Synthetic Royalty | 12–18% implied | 10–13% | Uncertain outcome, need flexibility |
When royalties make sense at Phase 3:
- Binary Phase 3 outcome with meaningful failure risk
- Need to preserve independence (avoid partnership/acquisition)
- Structure includes declining tiers and hard cap (like Revolution Medicines)
- Implied IRR under base case stays below 15%
When royalties are expensive debt at Phase 3:
- High conviction in approval and commercial success
- Venture debt or converts available at 10–13%
- Structure lacks adequate cap protection
- M&A is a realistic near-term exit path
CFO Verdict: Phase 3 synthetic royalties can be optimal for risk-sharing on uncertain assets, but demand rigorous structuring. The Revolution Medicines deal—with royalties declining to 0% above $8B sales—represents best-in-class protection. The Syndax deal at 13.8% royalty with 2.35x cap represents the expensive end.
Commercial Stage: Approved Products Have Different Economics
Once a product is approved and generating revenue, the financing landscape shifts entirely. The full debt menu opens, and royalty monetization (not synthetic royalties) becomes the relevant instrument for companies with existing royalty streams from partners.
Commercial-Stage Approved Product Deals (2024–2025)
The market distinguishes between two fundamentally different transaction types for approved products:
Existing Royalty Stream Monetization involves selling an established contractual right to receive royalties from a licensee. These deals typically trade at 7–12x annual royalty streams, translating to buyer IRRs of 8–12%.
| Company | Product | Upfront | Structure | Cap |
|---|---|---|---|---|
| BeOne / Royalty Pharma | Imdelltra | $885M | ~7% worldwide royalty | Low double-digit IRR target |
| Blackstone secondary | Amvuttra | $310M | 1% worldwide royalty through 2035 | Low double-digit IRR target |
| BridgeBio / HCRx & Blue Owl | BEYONTTRA | $300M | 60% of European royalties on first $500M sales | 1.45x cap |
| GENFIT / HCRx | Iqirvo | €185M | Portion of Ipsen royalties | 1.55x cap |
| Elanco / Blackstone | XDEMVY | $295M | U.S. royalties April 2025–August 2033 | ~30x trailing multiple |
Valuation Multiples by Approval Status
Approved product royalties command significantly lower discount rates than development-stage assets, reflecting eliminated clinical and regulatory risk.
| Development Stage | Discount Rate | Risk Premium vs. Approved |
|---|---|---|
| Preclinical/Phase 1 | 30–50% | +21–35% |
| Phase 2 | 20–30% | +11–15% |
| Phase 3 | 15–22% | +6–7% |
| Approved/Commercial | 9–15% | Baseline |
This represents a 6–15 percentage point risk premium for development-stage versus approved assets, meaning capital is roughly 50–70% cheaper for commercial products.
Traditional Debt Alternatives for Commercial Biotechs
| Instrument | Rate/Spread | All-In Yield | Example |
|---|---|---|---|
| Senior Secured (1st Lien) | SOFR + 5.0–6.5% | 9–11% | Alvotech at SOFR + 6.0% |
| Senior Secured (2nd Lien) | SOFR + 8–10% | 12–14% | Higher risk profiles |
| High-Yield (BB) | +225–275 bps | 6.5–7.5% | Rated issuers only |
| High-Yield (B) | +375–450 bps | 8.0–9.5% | Most accessible tier |
CFO Verdict: Commercial-stage companies should use traditional debt markets. If you're considering a synthetic royalty structure post-approval, you're almost certainly leaving money on the table compared to senior secured or high-yield alternatives.
The M&A Poison Pill: When Royalty Financing Blocks Value-Maximizing Exits
Beyond cost analysis, CFOs must consider strategic implications. Synthetic royalty financing can function as an unintended poison pill, reducing acquisition attractiveness and potentially blocking value-maximizing exits.
The Cytokinetics Warning
The Cytokinetics / Royalty Pharma $575M deal provides the clearest case study:
Deal structure:
- $225M commercial launch funding at 1.9x repayment over 10 years
- 4.5% royalty on aficamten sales up to $5B (increased from prior 3.5%)
- $100M for omecamtiv mecarbil with $237.5M clawback if trial fails
- $50M equity investment
M&A consequences:
- Fierce Biotech reported the deal "all but assured that a buyout is nowhere in the near future"
- Novartis reportedly exited acquisition discussions after deal announcement
- Stock dropped 17% on announcement despite $575M capital infusion
- A Mizuho survey found 21 of 29 investors estimated M&A probability at 1-in-5 or lower post-deal (previously 17 investors rated it 50%+)
Quantifying the M&A Impact
Consider an acquisition target with $2B peak sales potential and a 5% synthetic royalty for 10 years (expected NPV: ~$500M):
| Scenario | Without Royalty | With Royalty | Difference |
|---|---|---|---|
| Enterprise Value | $5B | $5B | — |
| Royalty Liability | $0 | ($500M) | ($500M) |
| Net Value to Acquirer | $5B | $4.5B | -10% |
The acquirer either reduces their offer, demands a royalty buyout pre-close, or walks away. None benefit target shareholders.
The M&A Decision Framework
| M&A Probability | Royalty Recommendation |
|---|---|
| High (>50% in 3 years) | Avoid royalties entirely—use venture debt/converts |
| Moderate (25–50%) | Negotiate change-of-control provisions, buyout caps |
| Low (<25%) | Royalties acceptable if economics work |
The "Expensive Debt" Threshold: When to Walk Away
Royalty financing becomes expensive debt when:
| Threshold | Metric | Action |
|---|---|---|
| IRR > WACC + 5% | Implied IRR exceeds cost of capital by 5+ pts | Reject or renegotiate |
| IRR > Debt + 4% | Implied IRR exceeds available debt by 4+ pts | Choose debt instead |
| Cap > 2.5x | Return cap exceeds 2.5x in <7 years | Excessive upside transfer |
| No cap / weak cap | Unlimited return potential | Unacceptable for high-conviction assets |
| Sales outperform 2x | Product achieves 2x projected sales | Royalty was mispriced |
Key Deal Terms to Negotiate
Protective Provisions Checklist
| Term | Target | Walk-Away Threshold |
|---|---|---|
| Return cap | ≤1.75x | >2.5x |
| Annual sales cap | 0% royalty above $X sales | No ceiling |
| Duration | ≤10 years | >15 years |
| Rate step-downs | Declining rates at higher sales | Flat rate regardless of success |
| Change of control | No consent required; buyout at 1.3x | Consent required; buyout at 2x+ |
| Prepayment right | At par after Year 3 | Locked for duration |
Best-in-Class Structure: Revolution Medicines
The Revolution Medicines deal demonstrates optimal structuring:
| Feature | Terms | Why It Matters |
|---|---|---|
| Tiered rates | 7.8% → 4.55% → 2.4% → 0% | Protects upside as success grows |
| Hard sales cap | 0% above $8B annual sales | Complete upside preservation |
| Combined structure | Royalty + senior debt | Optimizes overall cost of capital |
| Milestone funding | Tranches tied to Phase 3, approval | Avoids over-commitment on failure |
The Expanding Buyer Universe
Beyond Royalty Pharma's dominance (58% market share), several specialized buyers actively compete for deals:
| Buyer | AUM/Deployed | Focus | Notable Recent Deals |
|---|---|---|---|
| Royalty Pharma | $29B+ portfolio | Approved + late-stage | Syndax Niktimvo, Geron RYTELO, BeOne Imdelltra |
| HealthCare Royalty (HCRx) | $7B+ deployed, $3B AUM | Commercial/near-commercial | BridgeBio BEYONTTRA, GENFIT Iqirvo |
| DRI Healthcare | $3B+ deployed | Mid-sized, long patent life | TSX-listed, 75+ royalties |
| Blue Owl Capital | Emerging player | Flexible structures | BridgeBio (w/ CPP), Eagle BENDEKA |
| Blackstone Life Sciences | Large-scale capacity | Strategic partnerships | Elanco XDEMVY, Alnylam Amvuttra |
| SWK Holdings | ~$780M deployed | Sub-$50M transactions | 55+ transactions |
Key development: KKR acquired majority stake in HCRx in July 2025, signaling continued institutional capital flowing into the royalty space and likely increased competition for deals.
Accounting and Tax Considerations
Accounting Treatment
Despite legal structuring as "true sales," most royalty monetization transactions do not achieve sales accounting and must be recorded as financial liabilities (debt). The Covington study found 95% documented as true sales legally, yet the accounting outcome depends on whether the seller retains significant continuing involvement with the underlying asset.
When recorded as debt, companies book upfront cash as a liability with subsequent royalty payments allocated between principal and imputed interest expense. This affects debt covenants, financial ratios, and creates complex cash flow modeling requirements.
Tax Treatment
Transactions generally qualify as sales for federal tax purposes when buyer rights are contingent on product performance with no unconditional repayment obligation. However, income is usually characterized as ordinary income rather than capital gain under substantial rights and assignment of income doctrines.
The Complete Decision Matrix
Quick Reference: Verdict by Stage
| Stage | WACC | Synthetic Royalty IRR | Spread | Verdict |
|---|---|---|---|---|
| Preclinical | 15–18% | N/A | N/A | Not available |
| Phase 1 | 14–17% | 25%+ | +8–11% | Avoid—VD cheaper |
| Phase 2 | 12–15% | 18–25% | +5–12% | Conditional—model carefully |
| Phase 3 | 10–13% | 14–20% | +2–9% | Acceptable for risk-sharing |
| Commercial | 8–11% | 8–12% (monetization) | 0–3% | Favorable for existing streams |
Conclusion: The CFO's Royalty Decision Framework
Royalty financing is neither universally good nor bad—it's a development-stage-dependent financing tool whose value proposition varies dramatically based on clinical stage, available alternatives, and deal structure.
Use synthetic royalty financing when:
- Phase 2–3 with genuine clinical uncertainty
- Debt markets inaccessible at reasonable cost
- Equity markets closed or severely discounted
- Structure includes protective caps and step-downs
- Implied IRR stays within 3–5% of debt alternatives
- M&A is not a near-term priority
Use royalty monetization (approved products) when:
- Converting existing partner royalties to immediate capital
- Need non-dilutive, covenant-light financing
- Product has predictable cash flows
- Terms achieve 8–12% buyer IRR (1.3x–2.0x caps)
Avoid royalty financing when:
- Phase 1 where venture debt is available (cost differential too large)
- High conviction in blockbuster potential (variable payments punish success)
- M&A is probable within 3 years (royalties complicate deals)
- Structure lacks adequate caps (unlimited downside exposure)
- Implied IRR exceeds debt alternatives by >5%
The Bottom Line
Royalty investors targeting mid-teens IRRs are sophisticated capital allocators who understand exactly what they're buying. CFOs must be equally rigorous. The question isn't "Is royalty financing available?"—it's "Is the implied cost of this specific royalty deal lower than my available alternatives, adjusted for the probability-weighted upside I'm surrendering?"
Run the numbers. Model the scenarios. Protect your upside.
Disclaimer: The author is not a lawyer or financial adviser. This content does not constitute investment, financial, or legal advice. All information is derived from public sources which may have changed. Readers should conduct their own due diligence and consult qualified professionals before making any financing decisions.
Member discussion