
The rate underneath the royalty: duration, alpha, and the arbitrage that is really a liability trade

A royalty book carries a modified duration near five years, a discount rate in which the risk-free is now more than a third of the total, and a preferred return hurdle struck when the five-year point was under 1%. The asset has not changed. What an allocator gives up to own it has changed completely. This is the arithmetic, at the deal level and the fund level, as of August 2026.
1. The configuration
The front end has not moved in five meetings. The FOMC held at 3.50% to 3.75% on 29 July by a 9-3 vote, with Hammack, Kashkari and Logan dissenting in favour of a quarter-point increase, the first unified three-way directional dissent since September 2016. June dots put year-end 2026 between 3.6% and 4.1%. September is roughly evenly priced.
The back end is where the year happened. Against SOFR at 3.63%, the curve runs 4.22% at two years, 4.39% at five, 4.54% at seven, 4.70% at ten and 5.24% at thirty, the long end near twenty-year highs. That is 161bp from overnight to thirty years, and it is term premium rather than expected policy: oil rose roughly 21% in July on the Strait of Hormuz disruption, headline CPI ran 3.8% in April, and long-dated inflation swaps still clear near 2.4%.
Europe diverges hard. The ECB deposit rate is 2.25% after the 30 April increase, its first since September 2023, held on 23 July with the MRO at 2.40%. Switzerland sits at the other end: SNB policy rate 0%, SARON fixed at -0.05% on 7 August, ten-year Confederation spot at 0.438%. The Swiss and US ten-year points are 426bp apart.
Four rate complexes reaching four different places in the structure. SOFR touches the warehouse. The five-year point sets the discount rate. The whole curve sets what the seller's alternatives cost. The intermediate curve sets what an allocator forgoes to fund the strategy. They do not point the same way, which is why the question of whether high rates help royalty finance has no answer as posed, and why the answer that matters is different for the GP and the LP.
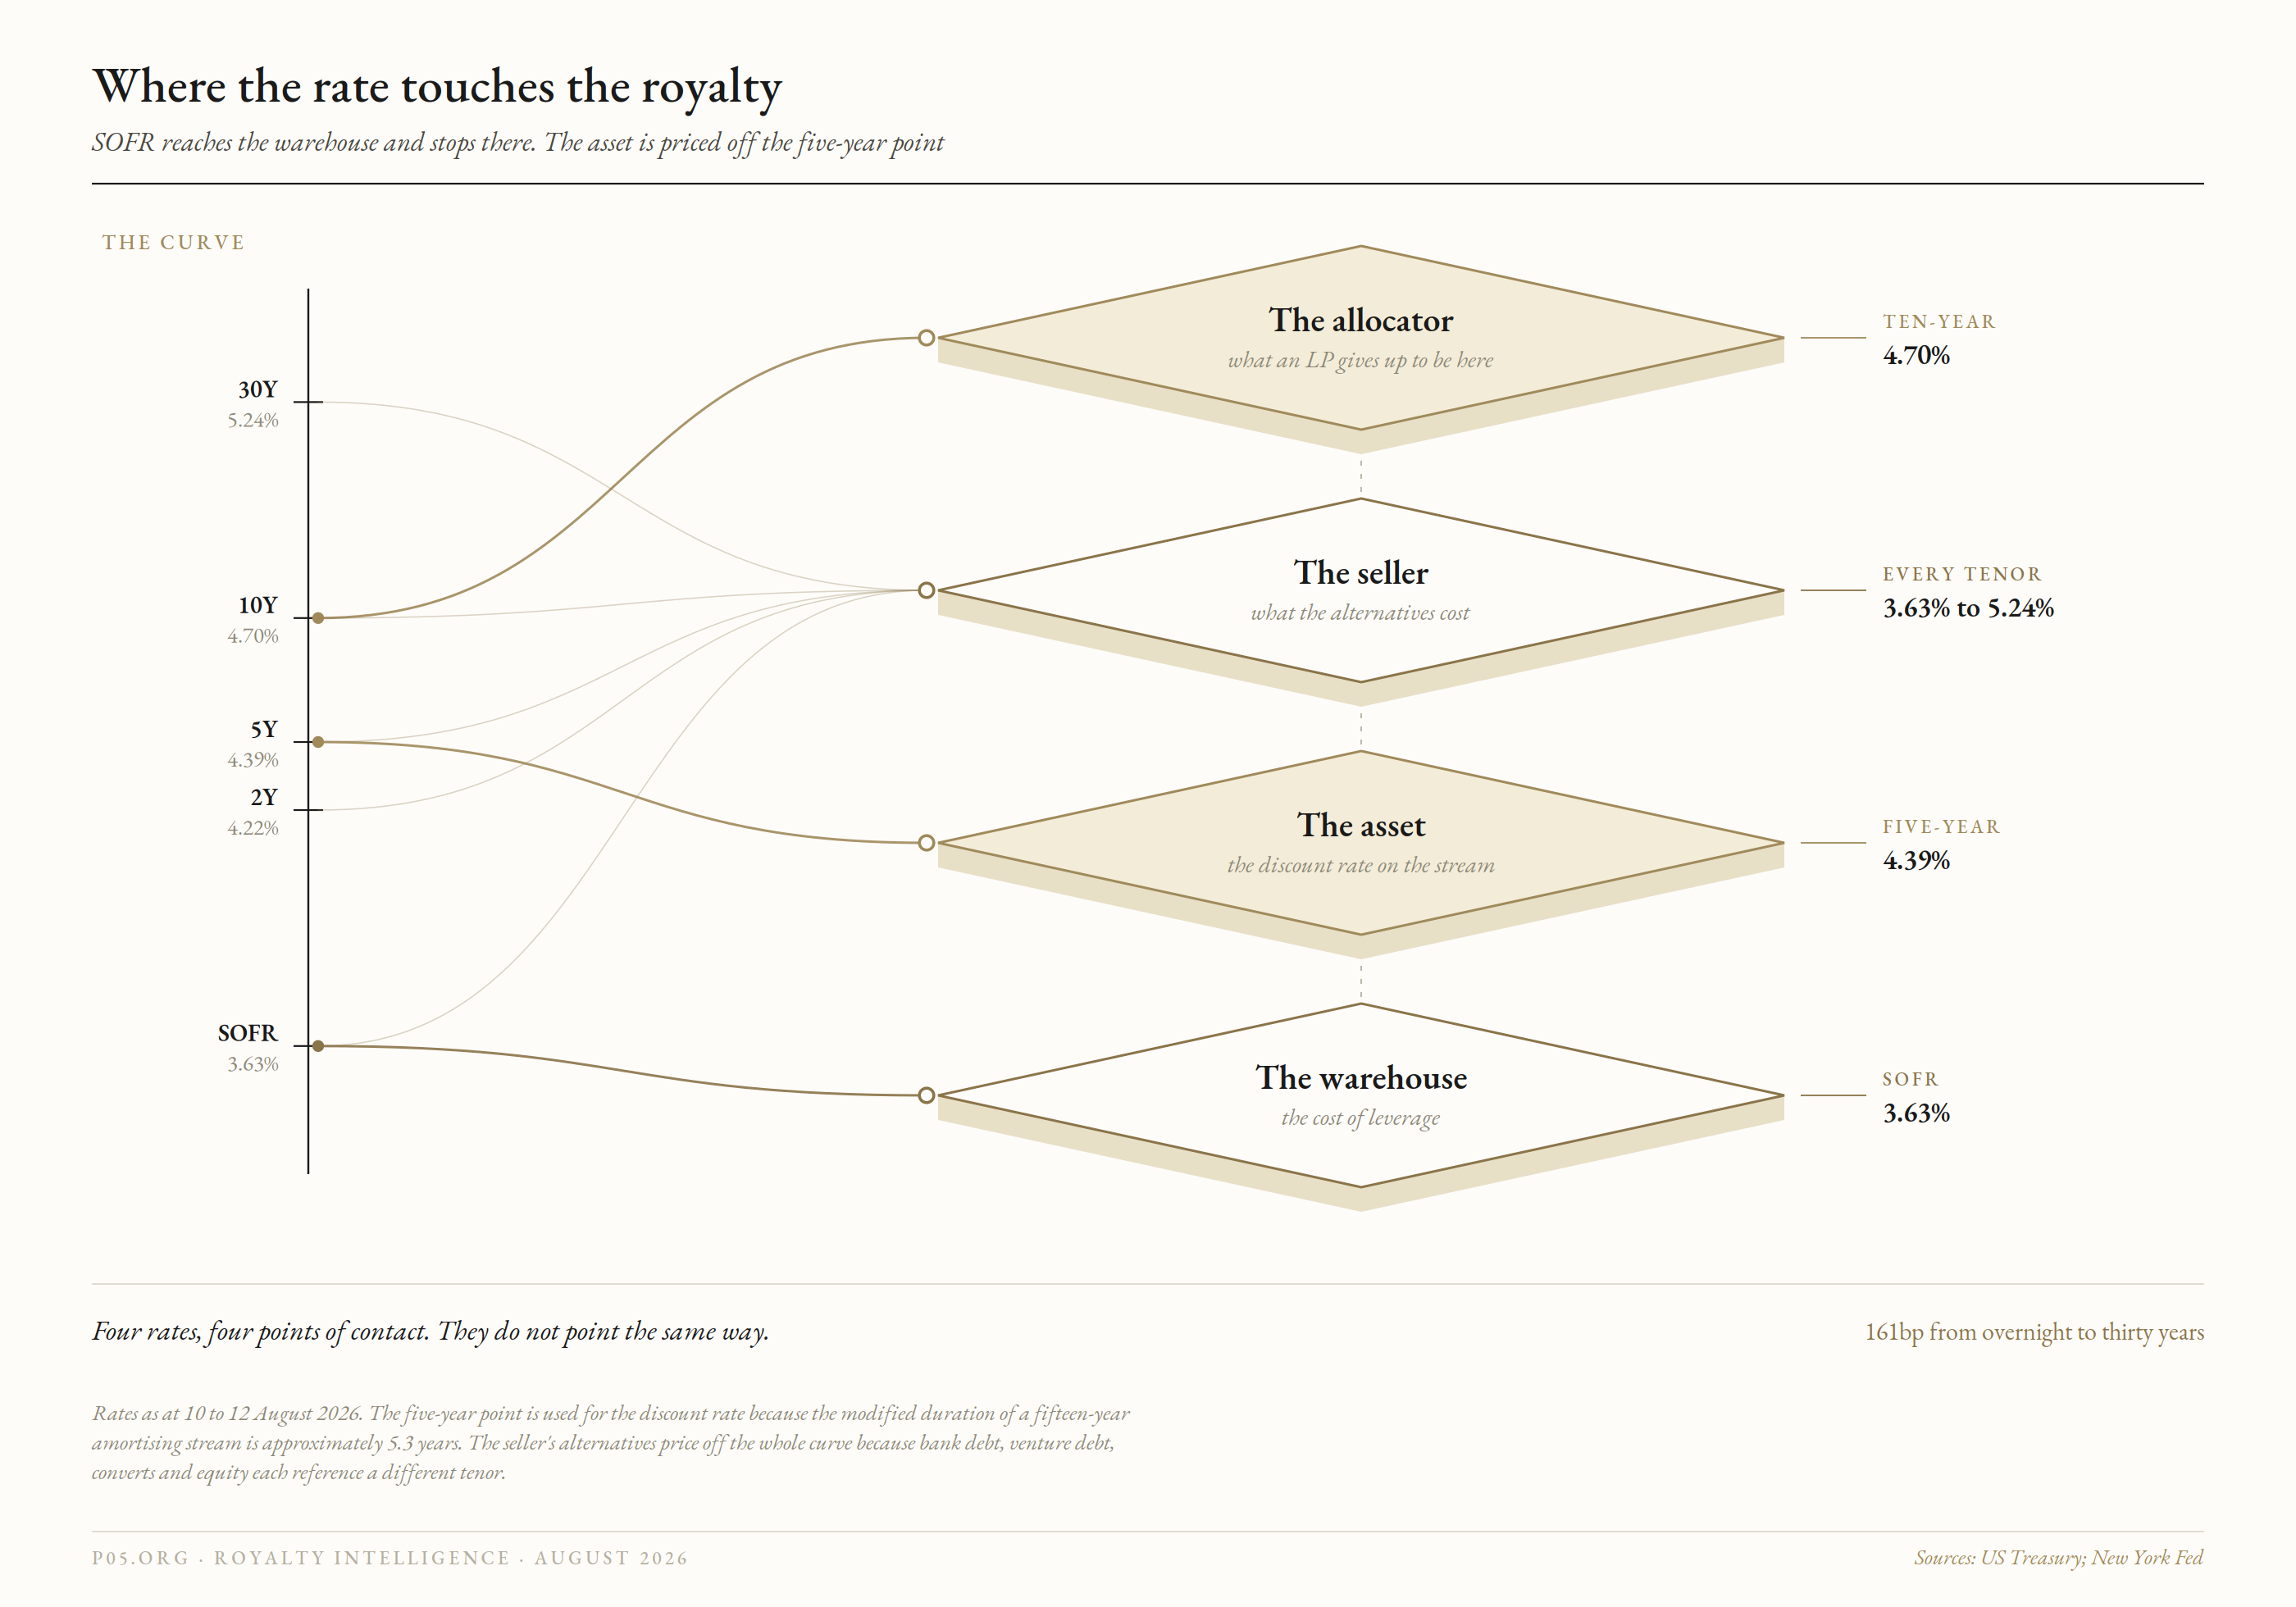
Figure 1. The four benchmark complexes and the point in the royalty structure each one reaches.
2. Duration: the asset is shorter than it is priced
A royalty is an amortising annuity terminating at loss of exclusivity, with no terminal value. Legal life and modified duration diverge sharply, and the industry habitually quotes the first while implying the second.
A level $50M stream at a 12% discount:
| Tenor | PV at 12% | PV at 13% | Change | Modified duration |
|---|---|---|---|---|
| 5 years | $180.2M | $175.9M | -2.4% | 2.48 |
| 8 years | $248.4M | $239.9M | -3.4% | 3.49 |
| 15 years | $340.5M | $323.1M | -5.1% | 5.34 |
A thirty-year Treasury at 5.24% runs a modified duration near 14.5. A fifteen-year royalty is about a third as rate-sensitive as the long bond it gets benchmarked against, and sits in the same duration bucket as intermediate credit. At 12%, year-15 cash discounts to 18 cents. The tail contributes almost nothing, which is why extending the runway moves the price far less than sellers expect and compressing the near years moves it far more.
Two calibrations against the terms that actually dominate:
- A 10% sales forecast error costs 10% of value, equivalent to roughly 290bp of discount rate on an eight-year stream and 196bp on a fifteen-year one.
- Pulling LOE from year 15 to year 10 takes the stream from $340.5M to $282.5M, a fall of 17.0%, equivalent to roughly 330bp.
Entry yields on approved commercial streams carry 700bp to 1,000bp over the risk-free for generic and biosimilar entry, payor and IRA exposure, counterparty credit and illiquidity. A 100bp move in the base is an 8% move in the discount rate, not a doubling. That is the mechanical reason royalty entry yields have been materially stickier than Treasury yields across the last four years, and why buyers who claim to have repriced their book to the curve mostly have not.
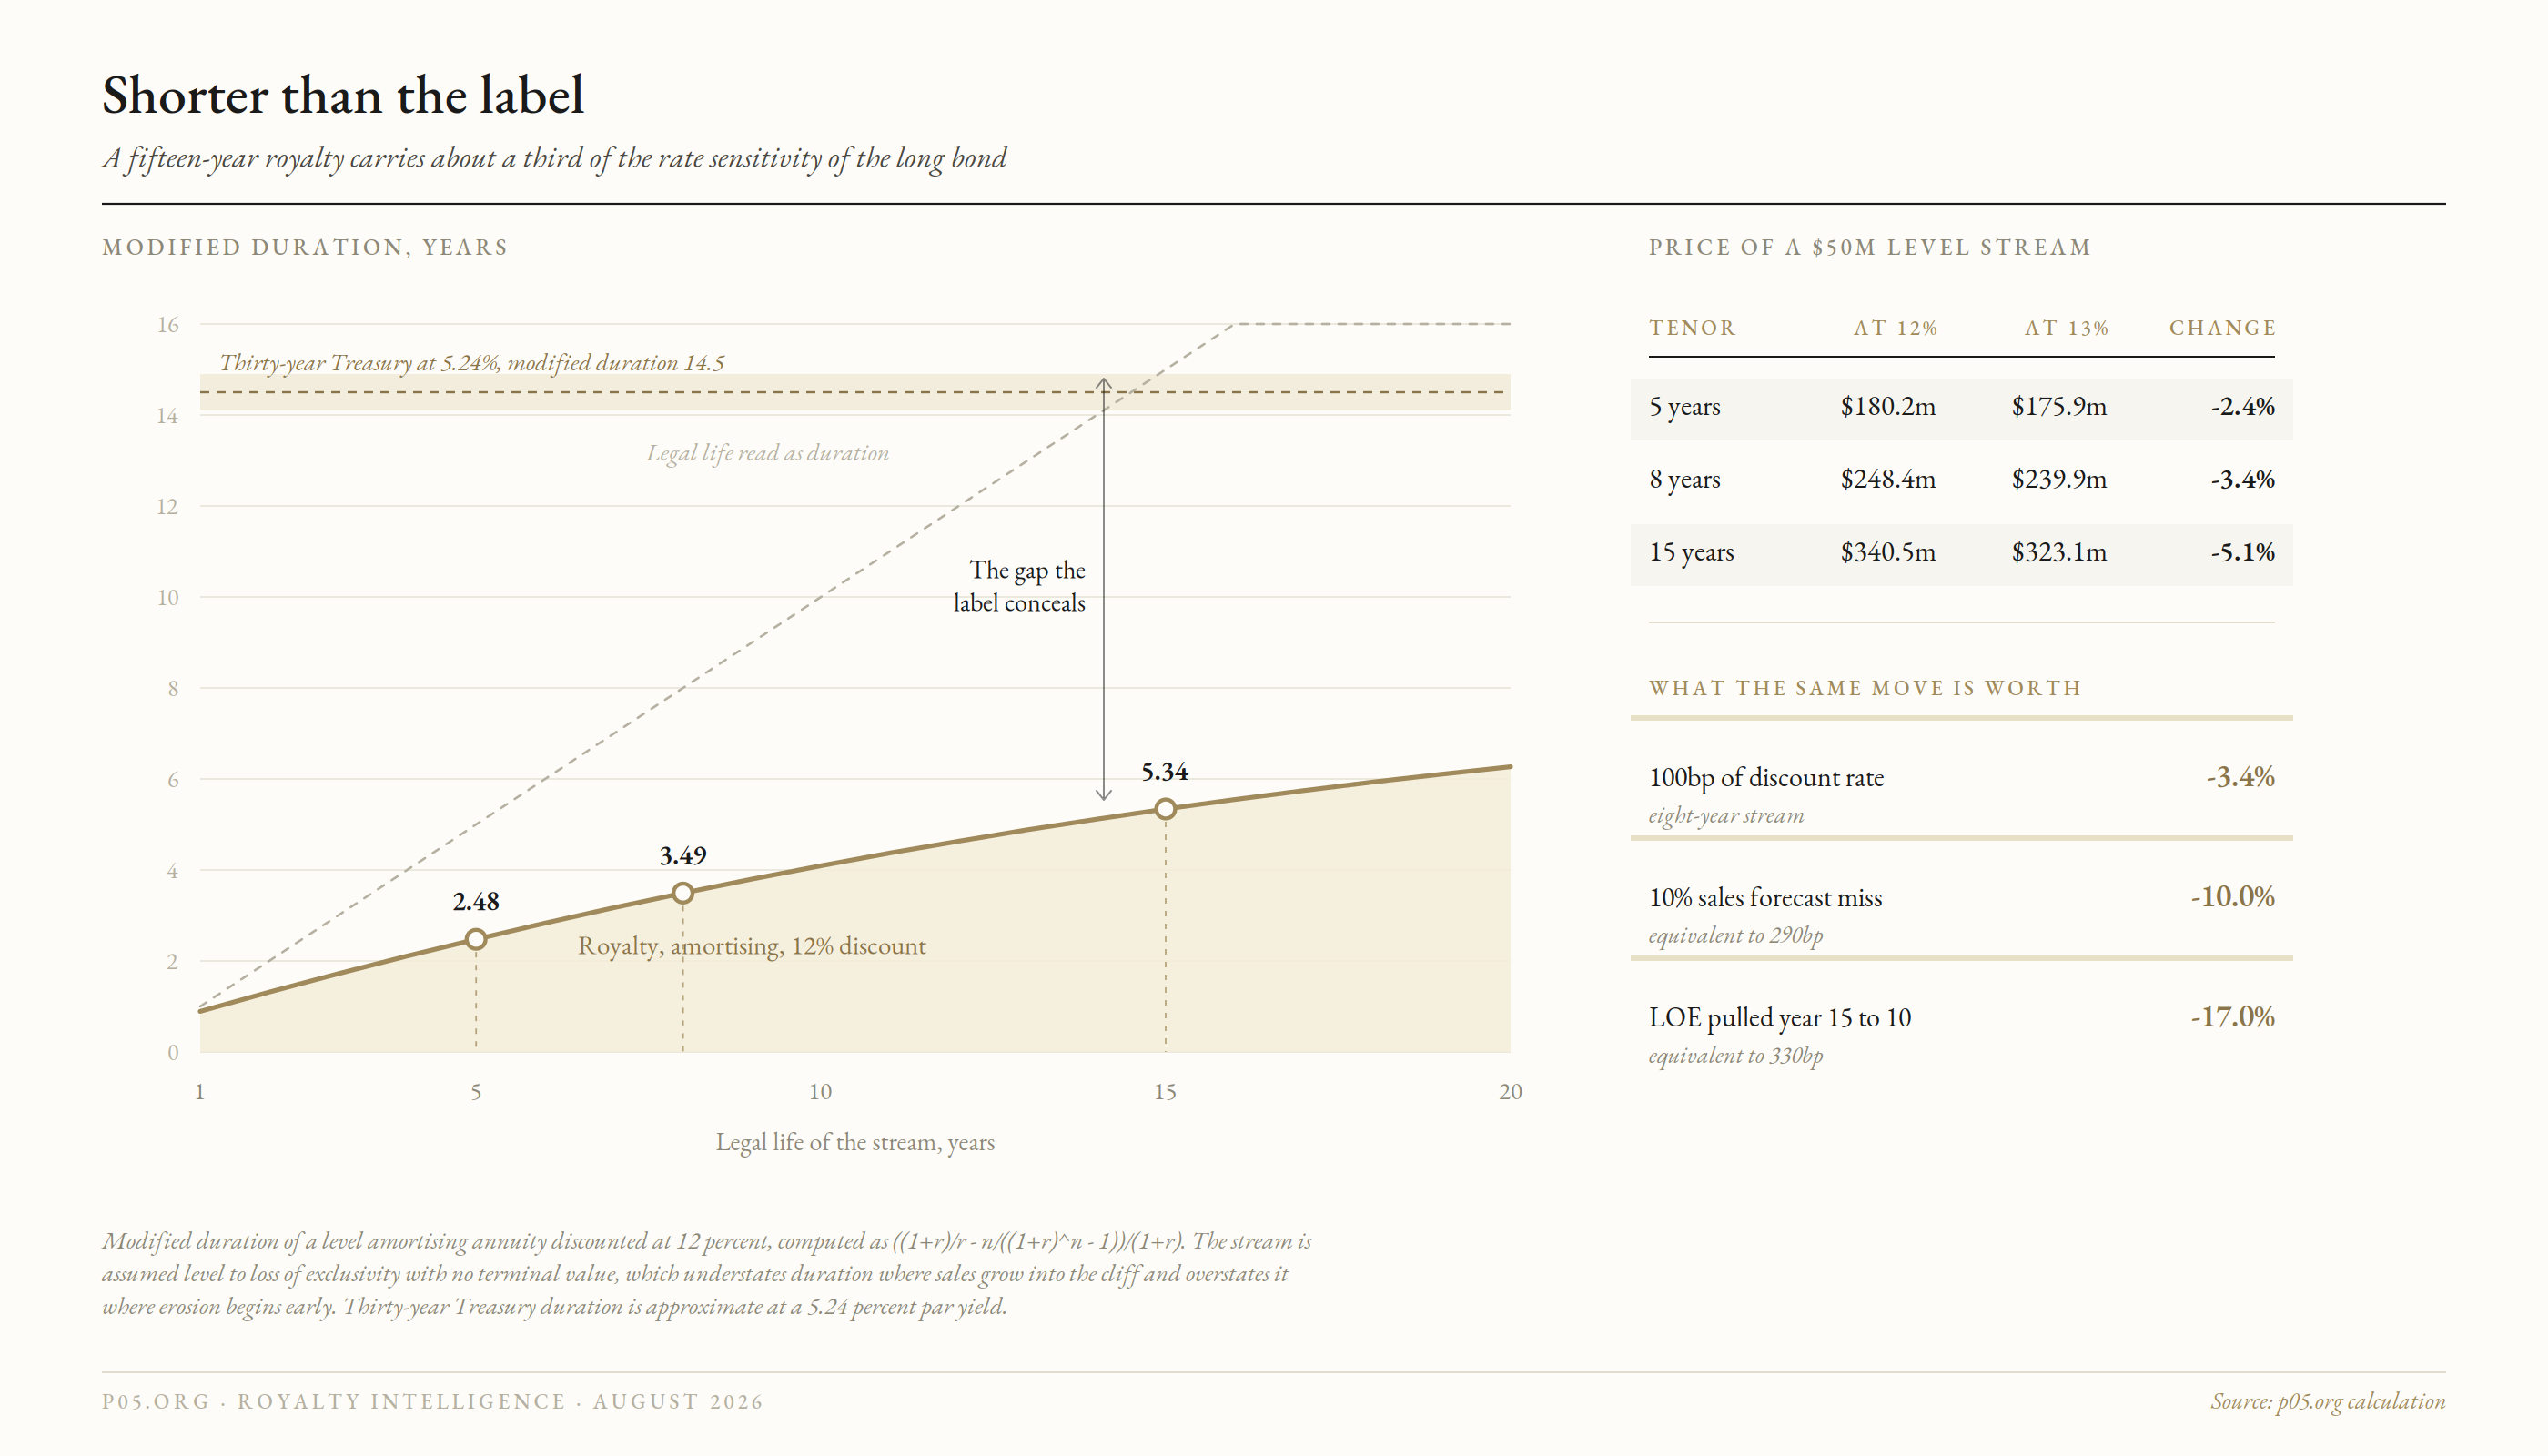
Figure 2. Modified duration of an amortising royalty against legal life, with the thirty-year Treasury for scale.
3. Which risk-free
The duration in section 2 dictates the answer and almost nobody uses it. A stream with a modified duration of 5.34 benchmarks against the five-year point, at 4.39%. Not SOFR, not the ten-year, not a WACC carried forward from the last fundraise.
The choice is not cosmetic on a curve this shaped. The same 12% gross IRR reports as 837bp over SOFR, 761bp over the five-year, 730bp over the ten-year, or 676bp over the thirty-year. That is a 161bp range produced entirely by curve-point selection, on an asset whose duration specifies the answer. Managers pick the flattering point, and in a curve this shape the flattering point is the front end, which is precisely the one with no economic claim on a five-year asset.
The duration-matched figure is the one that belongs in an LP letter. It is 761bp today against roughly 1,115bp at the 2021 average five-year of about 0.85%. The underwriting is unchanged. The spread has compressed by 354bp because the alternative improved.
4. Alpha, beta, and a preferred return that never repriced
Decompose the 12% gross unlevered royalty IRR against today's curve:
- 4.39% duration-matched risk-free
- roughly 390bp of credit and illiquidity beta, which takes you to the 8.0% to 8.5% first-lien direct lending yields Morgan Stanley expects to trough at in 2026
- roughly 370bp residual: the idiosyncratic pharma premium plus whatever alpha the manager actually generates
So 37% of the gross return is the Treasury, 32% is beta obtainable elsewhere in a floating-rate, first-lien, covenanted, four-year wrapper with a functioning secondary, and 31% is specific to the asset class. In 2021 the risk-free share of the same 12% was about 7%. A third of a royalty return is now simply the curve, delivered with binary patent risk attached and a carry charged on top.
Which brings the fee structure into view. An 8% preferred return was a genuine hurdle when the five-year averaged under 1%: roughly 715bp of real hurdle before the GP participated. Against a five-year at 4.39% the same 8% pref is a 361bp hurdle. The GP and LP split has moved roughly 350bp in the GP's favour without a single LPA being renegotiated, because the pref was struck as an absolute number in a world where absolute numbers meant something else. Very few royalty vehicles have repriced it, and it is the first thing a diligent LP should raise in 2026.
The net comparison runs the same direction. A 12% gross royalty IRR through a 2-and-20 over an 8% pref nets an LP roughly 9.5%. First-lien direct lending at 8.25% gross through lighter fees nets roughly 7%. The LP is being paid about 250bp of net pickup to accept an unsecured or thinly secured position, no covenants, no mark-to-market, no secondary, a five-year duration and a binary patent tail. That is the trade stated plainly, and it is materially worse than the version the asset class sold in 2019.
Where the alpha actually comes from. Not from forecasting. Consensus sales estimates reach every participant from the same three vendors, built off the same epidemiology, and in an intermediated auction the clearing price is the consensus discounted at the marginal buyer's hurdle. That is beta by construction. Royalty alpha has two genuine sources:
- Origination access. Streams held by universities, technology transfer offices, foundations, private companies and non-institutional holders do not clear at auction because there is no auction. Price is negotiated against a counterparty with no comparables. This is where the excess return lives, and it does not scale, which is exactly why large funds drift toward larger intermediated transactions where by construction there is none.
- Structure. True sale with a backup lien, a retained licence bringing section 365(n) into play, cash dominion, a bankruptcy-remote vehicle. These convert an identical cash flow into a better claim, and the rejection and assignment piece sets out what each is worth when the counterparty files. Structural alpha is repeatable and, unlike origination alpha, it scales.
A fund whose returns come from neither is selling levered beta with a pharma label, and at a 361bp real hurdle it is being paid handsomely to do so.
5. Does deal flow rise with rates? The ratchet
Royalty financing became more prevalent as rates rose and has not become less prevalent as they fell. The relationship is real, and it is one-way.
The series, from Gibson Dunn's tracker: deal value of $5.2B in 2020, a trough of $3.9B in 2022, and $7.1B in 2025, with median deal size reaching $221M. The tracker holds 133 transactions across the six years and reports 25 to 27 per year from 2023 onward, which implies roughly 18 per year across 2020 to 2022. Count therefore rose by something close to 40% between the zero-rate period and the high-rate period, then stopped moving.
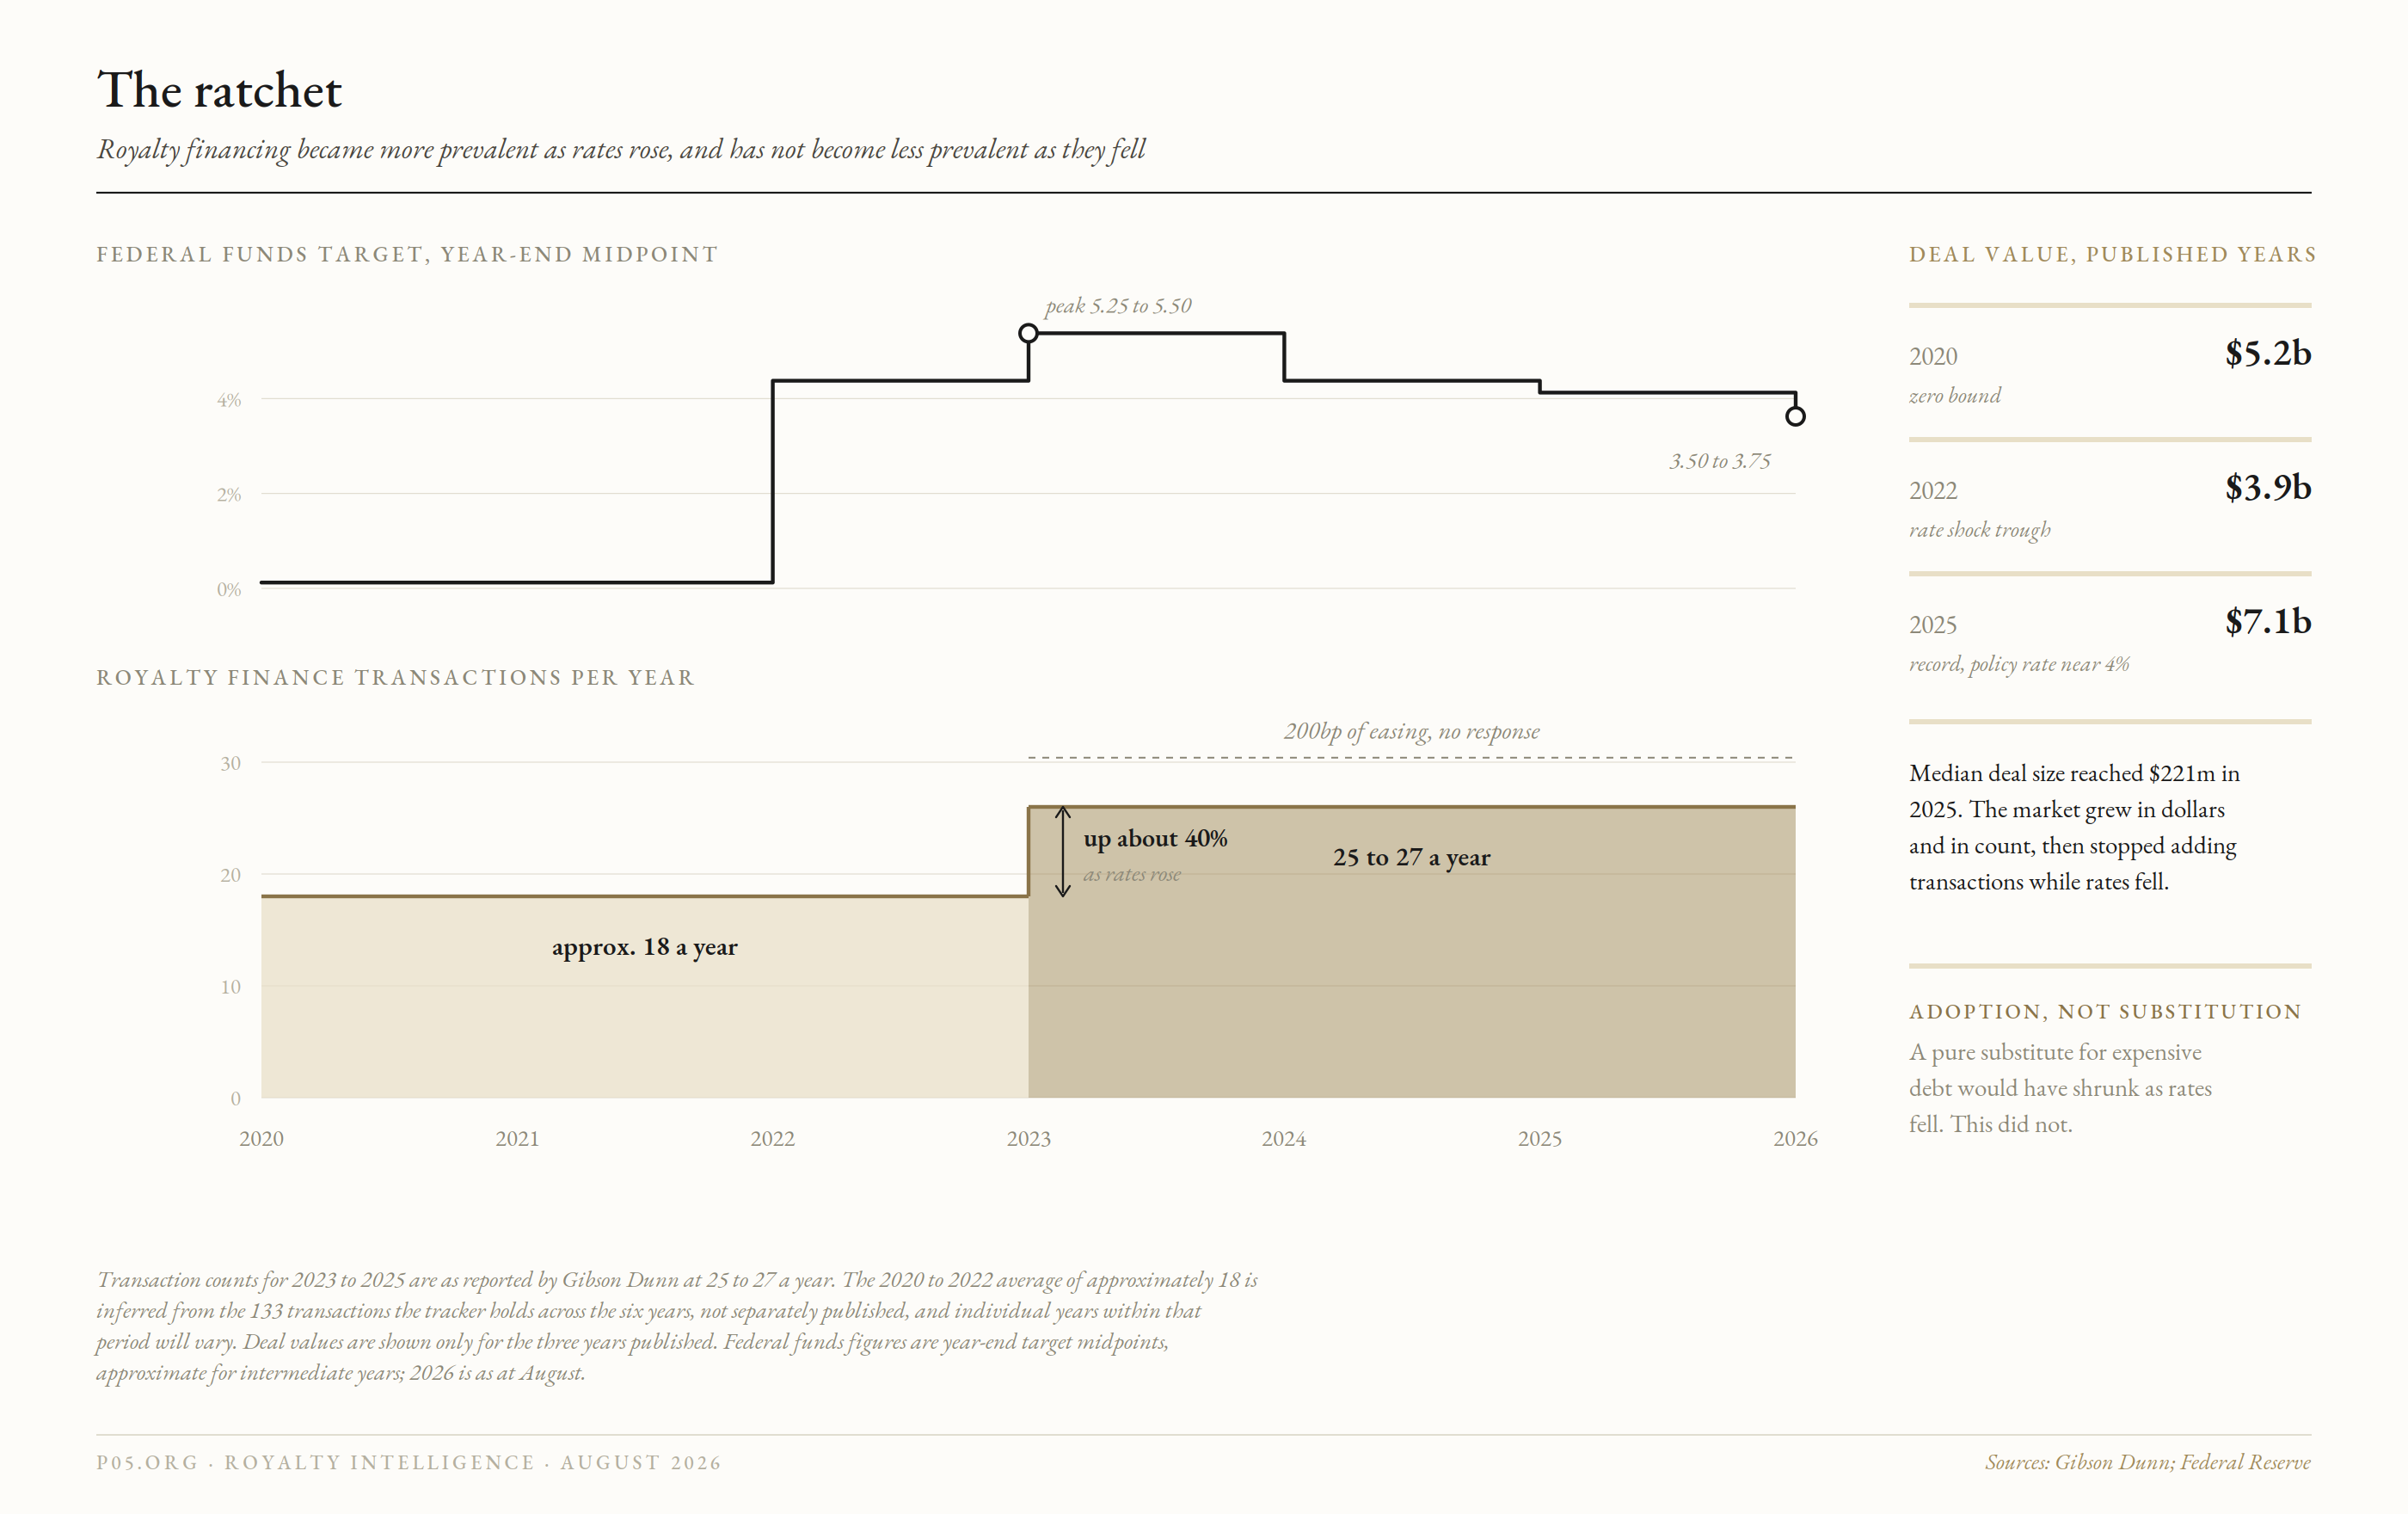
Both legs matter and they say different things.
Rising leg, 2020 to 2023. The policy rate went from the zero bound to 5.50% and both count and value rose, with a one-year collapse in 2022 that section 11 attributes to velocity rather than level. Higher rates made bank debt expensive and covenant-heavy, compressed biotech equity multiples, and shut the IPO window. Royalty capital won those competitions on price and on dilution, and the instrument was adopted.
Falling leg, 2023 to 2026. Two hundred basis points of easing produced no change in count whatsoever. Volume did not revert.
That asymmetry is the finding. If royalty financing were purely a substitute for expensive debt, easing would have shrunk it. It did not, because what happened between 2020 and 2023 was adoption rather than substitution: the instrument entered the standard capital-formation toolkit and stayed there. The rate cycle was the catalyst, not the driver. Gibson Dunn reaches the same place from the other direction, reading the recovery above 5% as evidence that demand is embedded in how biopharma funds itself rather than dependent on cheap capital.
The practical version for an origination desk: count is now gated by the supply of financeable assets, which is a function of approval flow and the pipeline eight years back, not the curve. Size is gated by capital availability and seller need, both rate-sensitive. So rates move dollars and no longer move transactions, and a team measured on deals closed will find throughput flat regardless of what the Fed does.
Two confounds are worth stating rather than assuming away.
The first is the deployment lag. Record volume in 2023 to 2025 was deployed from capital raised in 2020 to 2022, at ZIRP-era hurdles, by funds obliged to put it to work inside an investment period. The correlation between high rates and high volume in that window is partly a lag artifact. The genuine test is the vintage being raised now against a 4%-plus risk-free and section 4's hurdle arithmetic, and that test is running.
The second is the equity cycle, which moves with rates and dominates the seller's decision. The XBI returned roughly 36% in 2025, eleven biotechs completed IPOs across the whole of that year, ten priced in Q1 2026 alone, and Kailera closed at $625M in April. Against that, roughly 64% of public biotechs sit below $100M of market capitalisation with under twelve months of cash.
That bifurcation makes substitution asymmetric in a way aggregate volume conceals. At the top of the market a follow-on at an improving multiple now beats selling a royalty, and the high-quality issuer that monetised in 2023 is raising instead. At the bottom, where equity is unavailable at any price, royalty capital faces no competition. Streams reaching the market therefore skew smaller and toward issuers without alternatives. That is a composition shift, and residual large transactions mask it entirely in the headline number.
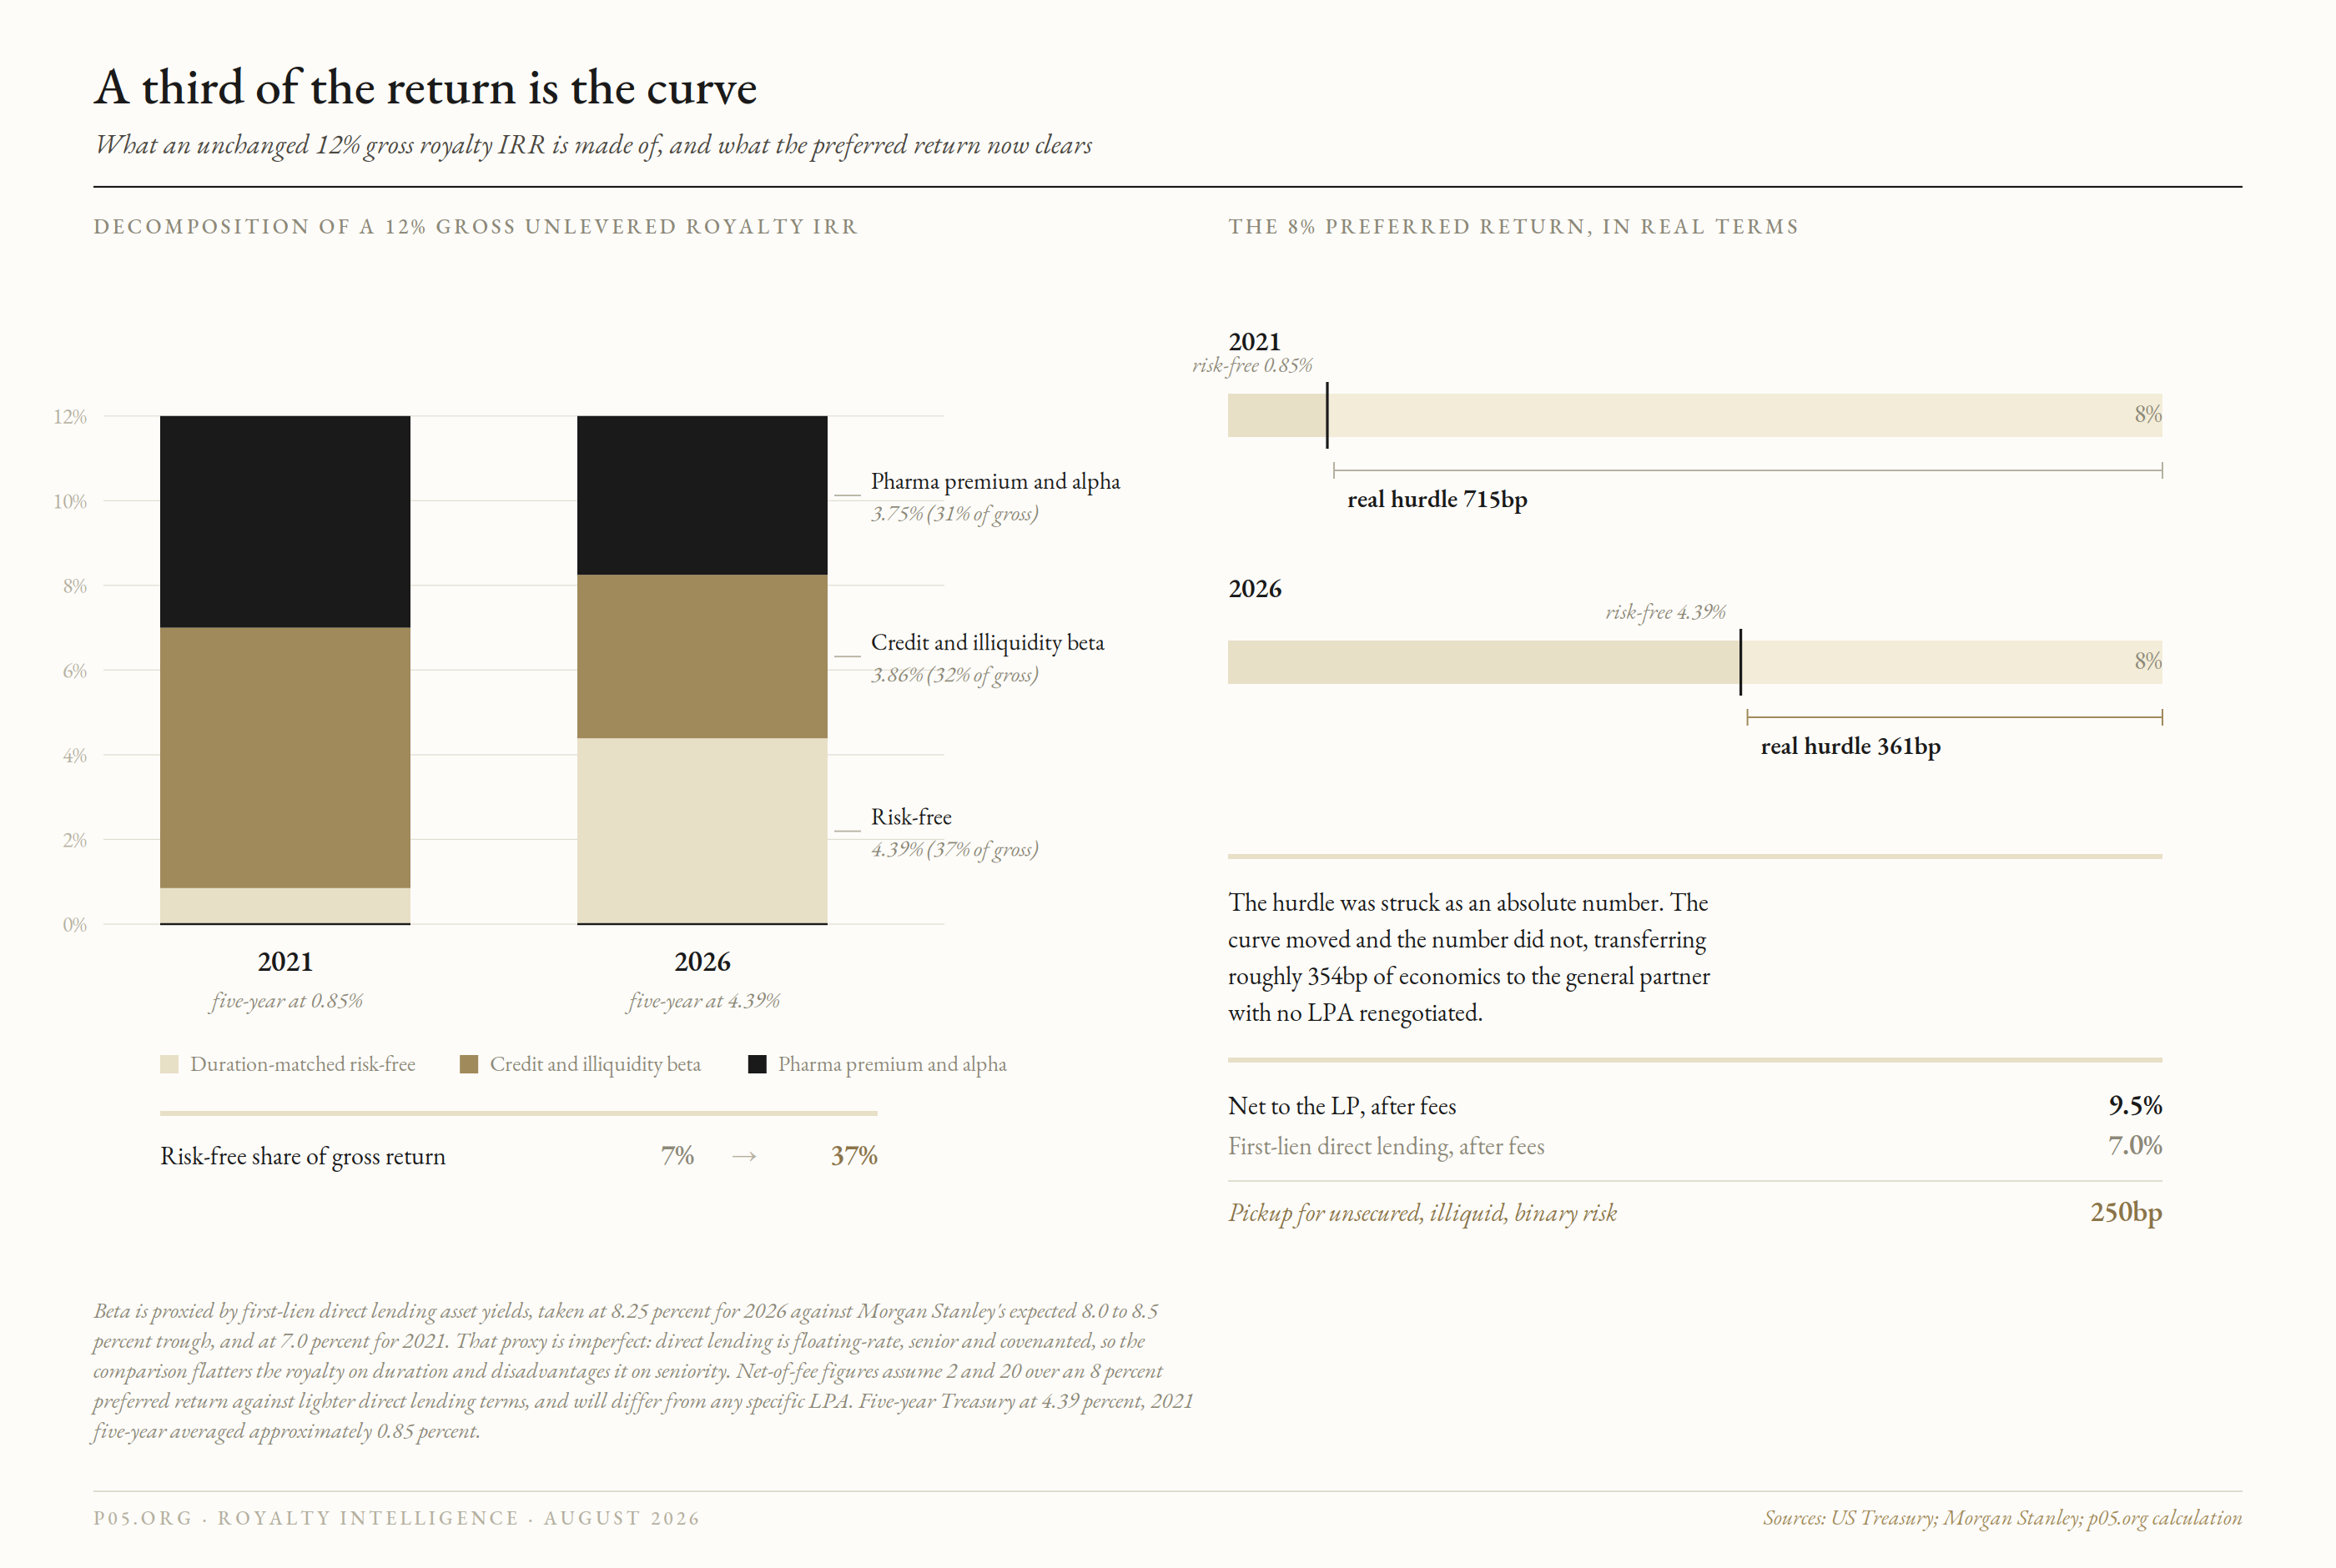
Figure 3. Royalty finance deal value and transaction count against the policy rate, 2020 to 2025. Value tracks the rate; count does not.
6. The LP and the GP want opposite environments
This is the structural problem in the asset class and it is rarely stated directly.
A GP buying royalties wants high rates: depressed asset prices, defensible entry yields, expensive seller alternatives, and a bottom half of the market with nowhere else to go.
An LP funding royalties wants low rates, for reasons that have nothing to do with the asset. A pension carrying a 7% actuarial target against a 1.5% risk-free cannot reach it inside fixed income and must reach into illiquid, complex, uncorrelated strategies to close the gap. Royalties at 12% gross were not attractive in that world so much as necessary. At a 4.39% five-year, with first-lien direct lending at 8.0% to 8.5% and investment grade paying materially more than it did, that 7% target is met by simpler instruments. The alternatives boom from 2010 to 2021 was a yield-starvation phenomenon, and high rates un-starve the allocator.
So buy-side opportunity and fundraising capacity are anticorrelated. Royalty funds can buy best precisely when they can raise least, and raise most easily precisely when assets are expensive and sellers have alternatives. That is a procyclical funding structure pointed the wrong way against the opportunity set, the same defect that produced the private credit vintage problem. It also explains the deployment lag in section 5: the industry's capital arrives one cycle after the environment that justified raising it.
The three exits from the resulting squeeze are all uncomfortable.
- Raise entry yields, pay sellers less, narrow the funnel at the quality end, compounding the composition shift in section 5.
- Hold the premium and defend it on correlation, the argument that brought KKR's asset-based finance platform into the sector via HCRx off a $6.5B fundraise. That is a diversification argument rather than a return argument, and section 7 is why it is weaker than it sounds.
- Lever to close the gap, which reimports section 9.
7. Royalties against the rest of the market
The asset class does not fit an allocation bucket, and that is not a marketing problem, it is a pricing one.
The cash flow profile is infrastructure. Contracted, amortising, self-liquidating, non-cyclical in demand, and carrying one genuine structural advantage over every form of credit: a royalty never has to refinance. No maturity wall, no extension risk, no covenant reset, no dependence on a functioning primary market at any point in its life. That property is worth more than the market prices it and it is the strongest thing in the asset class.
The return profile is mezzanine. Low double digits gross, unlevered.
The risk profile is equity. Binary patent and generic entry exposure, typically no seniority, typically no financial covenants, and a policy overlay in the IRA and most-favoured-nation pricing that can reset the cash flow by statute.
Infrastructure cash flows, mezzanine returns, equity tails. No allocator has that bucket. In practice royalties get funded from private credit, opportunistic credit, or a life sciences sleeve depending on the institution, and each carries a different hurdle. Which is why an identical stream clears at three different prices for three different buyers, and why the arranger's job in this market is buyer-matching at least as much as pricing.
The uncorrelated claim, taken seriously. It is the central marketing proposition of the asset class and it is half true, in a way worth separating carefully.
The cash flow genuinely is uncorrelated. Prescription volume for an approved therapy does not track GDP, unemployment, credit spreads or the S&P. A patient on a maintenance biologic does not discontinue in a recession. That is real, rare, and the honest core of the pitch.
The price is not uncorrelated at all. It is a discounted cash flow, and the discount rate is a risk-free plus a spread, both of which move with the macro. Add the policy channel, where the IRA and most-favoured-nation pricing can reset the cash flow by statute rather than by market, and the asset carries two large systematic exposures.
So: the uncorrelated part of a royalty is the cash flow, the correlated part is the price, and investors are sold the first while owning the second. Which of the two you actually experience depends on whether you hold to maturity or ever need to sell, which is the same distinction that separates an insurer from a drawdown fund in section 8.
Two further qualifications an allocator should apply. First, correlation matters at the moment of stress, and royalty's stress correlation to rates and policy is high, so the diversification fails precisely when it is needed. The 2022 to 2026 window tested exactly the two factors the asset class does not diversify and left untested the one it does. It diversifies the risk allocators already hedge and concentrates the risk they do not.
Second, and more awkwardly, the measured correlation of an unmarked asset is a statement about the valuation policy, not about the asset. No mark-to-market suppresses reported volatility and correlation simultaneously, so any allocator running a volatility-based risk budget will systematically over-allocate to royalties for the identical reason they over-allocated to private credit.
The reported Sharpe ratio of a royalty book is substantially an artifact of not marking it. Worth saying in a diligence meeting before someone else says it in a redemption request.
8. Capital arbitrage is a liability trade
The gap royalty funds actually harvest is not between price and value. It is between the required returns of two balance sheets holding an identical cash flow, and it is sourced almost entirely on the liability side.
Tranching. Pool royalties yielding 12%, sell the senior 65% into rated paper, retain the equity. At a senior cost of 7%, residual return on retained equity is 21.3%. The precedents are the Wood Creek and Concord music transactions and the Hipgnosis and Lyra structures, with the $2.025B MorphoSys package as the pharma anchor. The rating turns on true sale, non-consolidation and bankruptcy-remote opinions, which is the same section 365 analysis in a different suit.
The rate sensitivity here is more specific than it first appears, and it is worth resisting the easy version. Holding the asset yield at 12%, the same structure at a 2021 senior cost of 3.5% returned 27.8%, which suggests the curve has taken 650bp off the trade.
But that comparison assumes entry yields are perfectly sticky. Run a 100bp shock properly and the sign depends entirely on relative repricing speed: with sticky entry yields moving to 12.3% against a senior cost of 8.0%, retained equity falls to 20.3%; with full pass-through to 13.0%, it rises to 22.3%.
So the securitisation arbitrage is not a bet on the level of rates. It is a bet that senior tranche cost reprices more slowly than royalty entry yields, and it loses that bet, because rated paper reprices with the curve at issuance while entry yields lag by quarters for the reasons in section 2. Rising rates therefore compress the trade in the near term and it recovers as entry yields catch up. It is a timing exposure, and a sponsor warehousing assets into a planned takeout is short exactly that timing.
Balance sheet migration. Move the asset from a drawdown fund with a five-year hold, an investment period and 20% carry onto an insurance or ABF balance sheet with long-dated, low-cost, non-callable liabilities, no fund life and no carry. Same stream, several hundred basis points lower required return, and the insurer outbids on every auctioned asset.
This is what the ABF platforms are doing, and it is not an underwriting advantage. It is a funding advantage plus a regulatory capital treatment.
The currency version is what European sponsors most often get wrong. A 426bp gap between the Swiss and US ten-year looks like a funding arbitrage. Hedged, covered interest parity removes it in the cross-currency basis.
Unhedged, at CHF 0.8082 and with the SNB signalling increased willingness to intervene against franc appreciation, the buyer is running an FX book with a royalty portfolio attached. What the differential genuinely buys is the same thing as above, liability duration and cost on a European insurance balance sheet, not the exchange rate. For an arranger placing USD streams onto EUR or CHF balance sheets the basis must be allocated explicitly in the term sheet, because across a five-year duration it is worth more than most of what gets negotiated in the covenant package.
Instrument form. Convert product-level royalty exposure into parent-level credit that prices off the corporate curve and can be rated, which is what the development funding bond does, and which is why the MorphoSys bonds became money-good on an investment grade acquisition rather than on a sales outcome.
Seller-side accounting. Large pharmaceutical sellers transact partly for balance sheet and income statement treatment. A seller optimising an accounting outcome will accept a worse economic price, and the buyer captures the difference. It is the cleanest arbitrage in the market and it is available only to counterparties who understand the seller's reporting constraint better than the seller's banker does.
The conclusion across all four is uncomfortable for independent managers. Beta accrues to the cheapest balance sheet and alpha comes from proprietary origination, and there is nothing in the middle. A drawdown fund buying intermediated, auctioned, consensus-forecast streams competes for beta against insurers who fund cheaper, hold longer and charge no carry, and it loses that competition on price every time. The defensible position is the unintermediated segment, which is small, slow and does not scale, which is why the funds that grow drift out of it and become levered beta with a research department.
9. The warehouse
A royalty acquired at a fixed price on a fixed projection is a fixed-rate asset. Levered with a floating warehouse, the position carries a rate mismatch unrelated to the underlying.
At a 12% unlevered IRR, 50% advance, Term SOFR plus 350bp, the facility costs 7.13% and equity returns 16.9%. The same asset at the same entry yield, levered identically in 2021, returned 20.4%. The front end alone has taken 358bp off the levered return with nothing changed in the label, the estate or the forecast.
Sensitivity scales as a/(1-a). At 50%, each 100bp of SOFR costs 100bp of levered return. At 65%, it costs 186bp. A fund running high advance rates on unhedged floating paper against fixed-price assets is carrying a leveraged short-rate position with a royalty portfolio attached, and a September hike would print in its returns a quarter before it printed in any script data.
The asymmetry is one-sided. The front end has a floor near current levels, three voting members are on record for a hike, and the option to fix or swap is cheaper now than after September. The other half is schedule: facility reset dates that do not line up with royalty payment dates leave a basis hedged by nothing and generally measured by no one.
10. The inflation hedge is legislated shut
A royalty is a percentage of net sales and therefore nominally indexed in principle. That was the historical case for the asset class as an inflation hedge, and it no longer holds on the volume that matters.
Manufacturers routinely took 7% to 10% annual US list price increases before 2022. The IRA inflation rebate reaches all Part B and Part D drugs, not only the negotiated cohort, and claws back the excess where ASP or AMP growth exceeds CPI-U. Above-CPI increases fell sharply from 2023, with a large share of the book held at or below inflation for the first time in decades. Add the maximum fair price reset at year nine for small molecules and year thirteen for biologics, subject to the orphan, low-spend and small-biotech carve-outs, and the price component is capped above and stepped down below.
The position in a 3.8% CPI environment is therefore adverse on both legs. The discount rate carries an inflation risk premium, visible in a thirty-year at twenty-year highs and swaps at 2.4%. The cash flow cannot outrun CPI on Medicare volume. Pre-2022, implicit real price growth partially offset the discount-rate effect; that offset is now approximately zero.
Real growth has to come from volume. A model carrying price growth above CPI on Medicare volume is not aggressive underwriting, it is an undisclosed rebate liability, and it is the most common single error in seller-prepared projections crossing the desk this year.
11. Velocity, not level
Rates did not break this market in 2022. Speed did.
The policy rate travelled from the zero bound to 4.25% to 4.50% inside nine months and volume contracted, then recovered to records with rates stabilised above 5%. The mechanism is execution rather than valuation. A royalty transaction runs three to nine months from indication of interest to signing, and pricing is fixed at closing with effectively no ongoing mark-to-market. A 150bp move in the discount rate between LOI and close forces the buyer either to absorb it or to reprice, and a reprice after diligence reads to the seller as a retrade. Deals die there. Level is absorbed within one repricing cycle because both sides recalibrate on the next term sheet. Velocity lands inside the execution window of deals already in flight.
The variable to watch is realised volatility of the five-year point, not its level. August 2026 reads as high level, moderate velocity, two-sided risk: workable to originate into, hazardous for anything carrying a ninety-day exclusivity at a fixed price.
12. Rates up, rates down: the whole book in one table
Running a 200bp shock through every channel at once, because the channels net against each other and no single one answers the question.
| Channel | Rates up 200bp | Rates down 200bp |
|---|---|---|
| Asset price, 15-year stream | Down roughly 10% | Up roughly 12% |
| Entry yields | Up, but lagging and partially | Down, lagging |
| Transaction count | No response | No response |
| Deal value | Up, seller need rises | Flat to up, equity substitutes at the top |
| Seller mix | Skews small and distressed | Skews back toward quality issuers |
| Warehouse cost | Up 1:1, levered return down a/(1-a) | Down, levered return up |
| Tranching arbitrage | Compresses near term, recovers with entry yields | Widens near term, decays |
| Balance sheet arbitrage | Widens, funding dispersion increases | Narrows |
| Duration-matched spread to LP | Compresses | Widens |
| LP appetite | Falls, target met elsewhere | Rises, yield starvation returns |
| Correlation narrative | Tested, fails on the price leg | Untested, sells easily |
Three conclusions fall out of the table that do not fall out of any single row.
The GP's book and the GP's franchise move in opposite directions. Rising rates improve every term of the investment case and damage every term of the fundraising case. Falling rates do the reverse. A manager reporting a strong vintage into an easing cycle is describing entry conditions that no longer exist, and a manager struggling to raise into a tightening cycle is being punished for the environment that will produce its best vintage. Neither is a skill signal, and both get read as one.
The two capital arbitrages point opposite ways, and that explains the last three years. Rising rates widen the balance sheet arbitrage, because funding cost dispersion widens and an insurer with locked-in long liabilities gains most against a fund marking to current market. Rising rates compress the securitisation arbitrage, for the repricing-speed reason in section 8.
Which is precisely why the sector's response to the 2022 to 2026 tightening was balance sheet consolidation, KKR taking HCRx and the ABF platforms building out, and not the pharmaceutical royalty ABS wave that the music market templates had been predicting since 2021. The structure that got built was the one the rate environment paid for.
The asset class gets more interesting to investors when rates fall and more interesting to buyers when rates rise, and those are different people with different mandates. An allocator asking whether royalties are attractive today is asking a question about the opportunity cost of their own portfolio, and at a 4.39% five-year with first-lien direct lending at 8.0% to 8.5% the honest answer is that royalties are less interesting than they were in 2021 and the assets are better. Both statements are true at once and the tension between them is not resolvable inside the asset class. It is resolved by who holds it: a balance sheet that can wait, or a fund that cannot.
13. What is ideal
The table settles direction by seat. What it does not settle is the level, and the answer there is that level matters far less than the two properties nobody optimises for.
Stability comes first, for the execution reason in section 11. A deal dies between LOI and close, not at the price, and the market's only genuine contraction in six years came from velocity rather than level. A high, stable curve beats a low, moving one for anyone actually transacting.
Slope comes second, and modestly positive is the answer. Inversion is the worst configuration available, raising the warehouse cost and holding the discount rate elevated at the same time, hitting the levered return from both ends. The steep back end of August 2026 is tolerable rather than good: it keeps entry yields defensible while offering nothing to the securitisation channel.
The composite, then, is a five-year in the 3.5% to 4.5% range with the front end roughly 100bp below it, low realised volatility, and inflation anchored well enough that the discount rate is not carrying an inflation risk premium stacked on top of the asset risk. Neither zero nor 2021, and closer to today than to either.
The zero-rate period deserves a specific verdict rather than nostalgia. It was excellent for fundraising and poor for everything else: entry yields compressed through buyer competition, converts and crossover equity took the best sellers, and the excess return looked generous only until the risk-free moved and revealed how much of it had been the curve. The industry raised its largest vehicles into precisely those conditions and deployed them into better ones, which flattered a generation of vintage returns and taught the wrong lesson about where the return came from.
What moves a position, and what only appears to
Moves it:
- The five-year point, where the duration of the book actually sits. Not SOFR, not the thirty-year.
- The preferred return hurdle measured against the current risk-free rather than as an absolute number struck in a different decade.
- Realised volatility between LOI and close, against a price fixed at signing with no mark-to-market.
- Advance rate and spread on the facility, at a/(1-a) sensitivity to SOFR, and whether the reset schedule matches the payment schedule.
- The clearing yield on first-lien direct lending, which is the allocator's actual comparator.
- Whether return is sourced from unintermediated origination or from an auction, because only the first is alpha.
- Cost and duration of the liabilities on the balance sheet holding the asset, which decides who wins any auctioned stream.
- The volume curve, since the price curve is capped at CPI-U on Medicare volume.
Only appears to:
- SOFR as a proxy for the discount rate. It reaches the warehouse and stops there.
- The phrase "long-duration asset". Fifteen years of legal life is a modified duration of 5.34.
- A reported spread over an unstated curve point, which is a 161bp choice today.
- A funding advantage from CHF or EUR, which covered interest parity removes on any hedged basis and which is an unhedged FX position otherwise.
- Diversification benefit, real against equities and absent against the rate and policy factors that actually moved.
- Low reported volatility, an artifact of the absence of a mark.
- The inflation hedge, capped at CPI on Medicare volume and stepped down at the negotiation reset.
- A policy cut as a buy signal. The cut moves the front end; the asset prices off the intermediate curve, and the two have decoupled repeatedly since 2024.
What each side should ask
For the company raising royalty capital
- What point on the curve is the buyer pricing off, and where was it at LOI?
- Is the buyer's funding fixed or floating, given that a floating-funded buyer facing a hike has a live incentive to retrade before closing?
- Is the equity window actually shut for this issuer, or is a stream being sold at a high discount rate while a follow-on is available at an improving multiple?
- Does the buyer's model carry price growth above CPI on Medicare volume, and is the resulting discount worth accepting?
For the royalty investor
- What is the modified duration of this stream, and does any hedge match it rather than the legal life?
- Was this stream sourced from an auction or a negotiation, and if the former, what is the source of return beyond beta and leverage?
- At the actual advance rate, how many basis points of levered return does 100bp of SOFR cost, and is that exposure open?
- What is the duration-matched spread, and would you buy it at that spread from the LP side of the table?
For the fund or portfolio holder
- Was the preferred return set against a risk-free that no longer exists, and what is the real hurdle today?
- Does the book carry one duration exposure repeated across every position, which no amount of therapeutic diversification reduces?
- If the strategy is sold on low correlation, is the correlation low to the factors the LP is actually exposed to, or only to the ones already hedged?
- If beta accrues to the cheapest balance sheet, what is the plan for the part of the book competing for auctioned assets against insurers?
The discount rate says high rates make streams cheap. The seller's alternatives say high rates make streams available in dollars but not in number. The warehouse says high rates make leverage expensive. The securitisation says high rates close the tranching arbitrage. The allocator says high rates make the strategy unnecessary. A manager occupies all five seats and the net depends on advance rate, liability cost, and whether the return was originated or bid for.
The level was never the constraint on transacting. Count did not move across two hundred basis points of easing, volume set records above 4%, and the only genuine contraction came when the curve moved faster than deals could close. The constraint is on the funding side and it is arriving now: a preferred return struck against a sub-1% risk-free, a duration-matched spread down 354bp, and a first-lien comparator at 8.0% to 8.5% that did not exist as a competitor in 2019.
Drug performance is decided in the clinic. What a stream clears at is decided by a curve nobody in the transaction controls. Whether the manager deserved the carry is decided by whether the stream was found or merely won.
All information in this article was accurate as of the research date and is derived from publicly available sources including Federal Reserve, ECB and SNB publications, US Treasury and Bureau of Labor Statistics data, SEC filings and issuer press releases, and legal and financial commentary. Information may have changed since publication. This content is for informational purposes only and does not constitute investment, legal, accounting, tax, or financial advice. The author is not a lawyer, accountant, tax adviser, or financial adviser.